Fall Ends on a Low (Temperature) Note
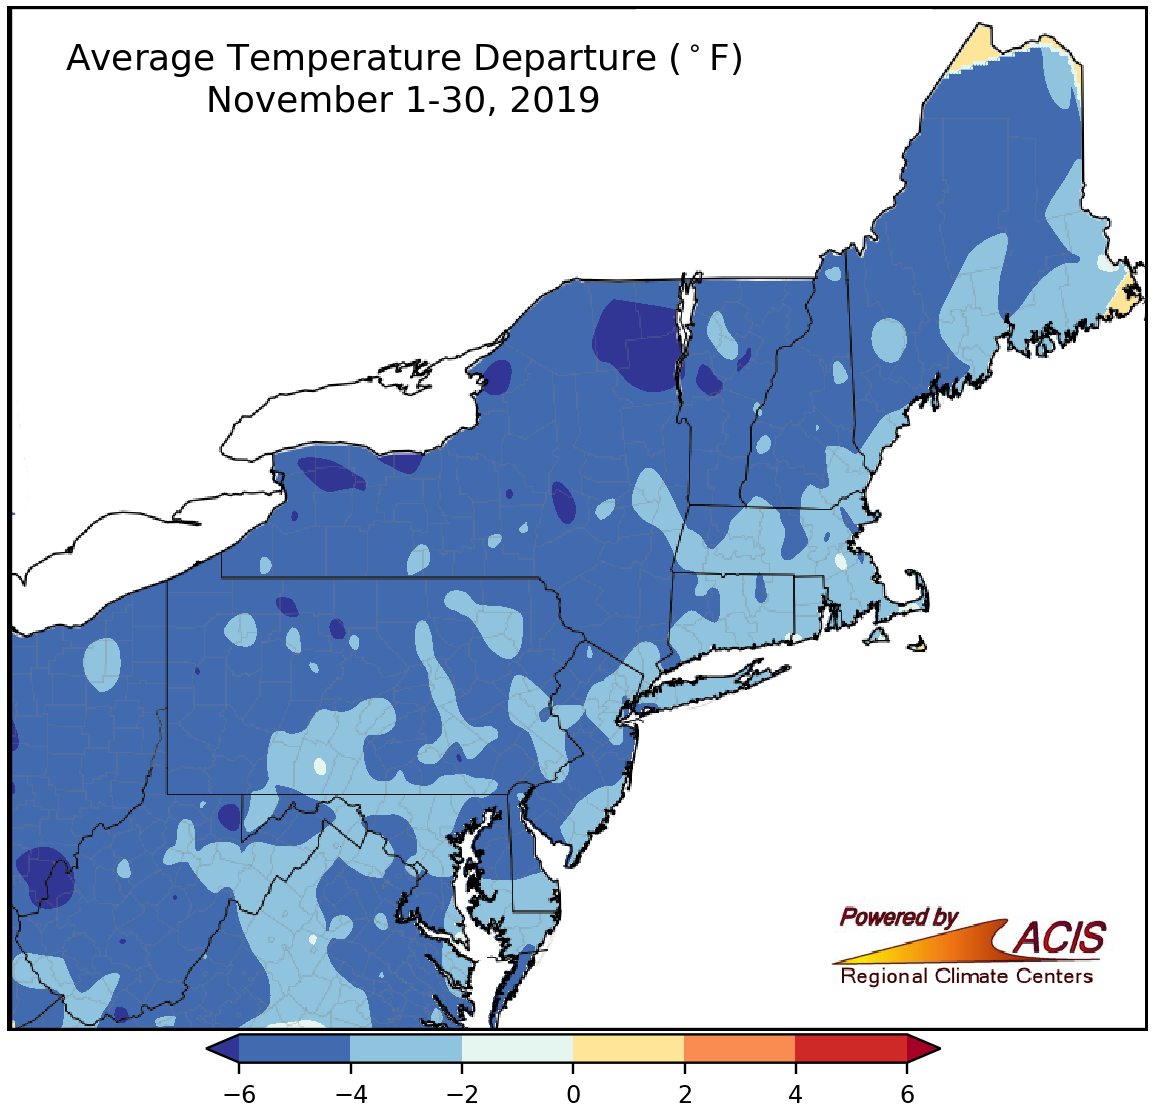
November average temperatures ranged from 2°F to more than 6°F below normal.
November wrapped up on the cold side of normal for the entire Northeast, with average temperatures ranging from 2°F to more than 6°F below normal. The largest departures were in West Virginia, northern Pennsylvania, New York, and central Vermont. At the 35 major climate sites, average temperatures ranged from 5.5°F below normal in Binghamton and Rochester, NY, to 1.9°F below normal in Boston, MA, with 25 of the sites ranking this November among their 20 coldest on record. In fact, it was the first time in a year (since November 2018) that all 35 major climate sites had a colder-than-normal month. In addition, Caribou, ME, recorded its earliest subzero temperature on record with a low of -1°F on November 17.
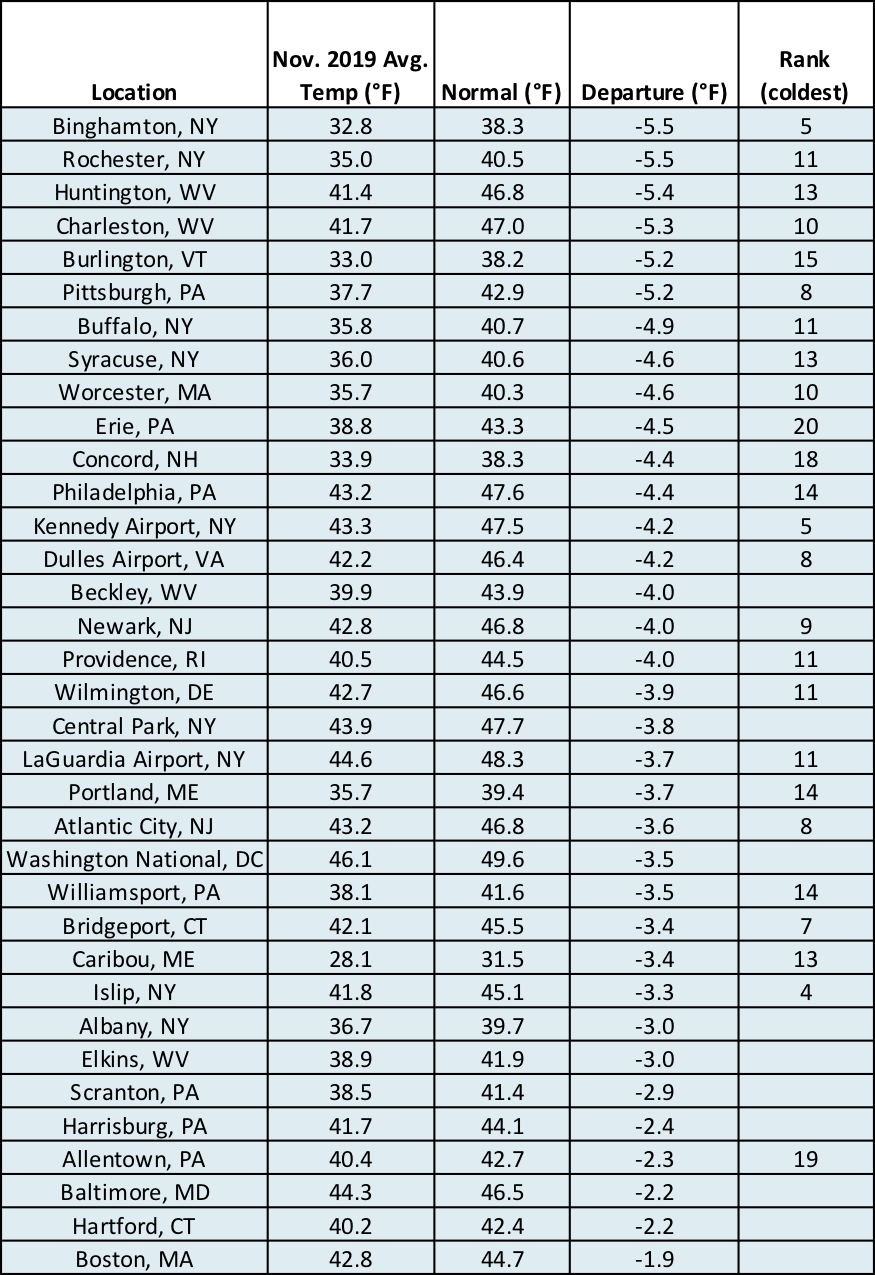
Twenty-five major climate sites ranked this November among their 20 coldest on record.
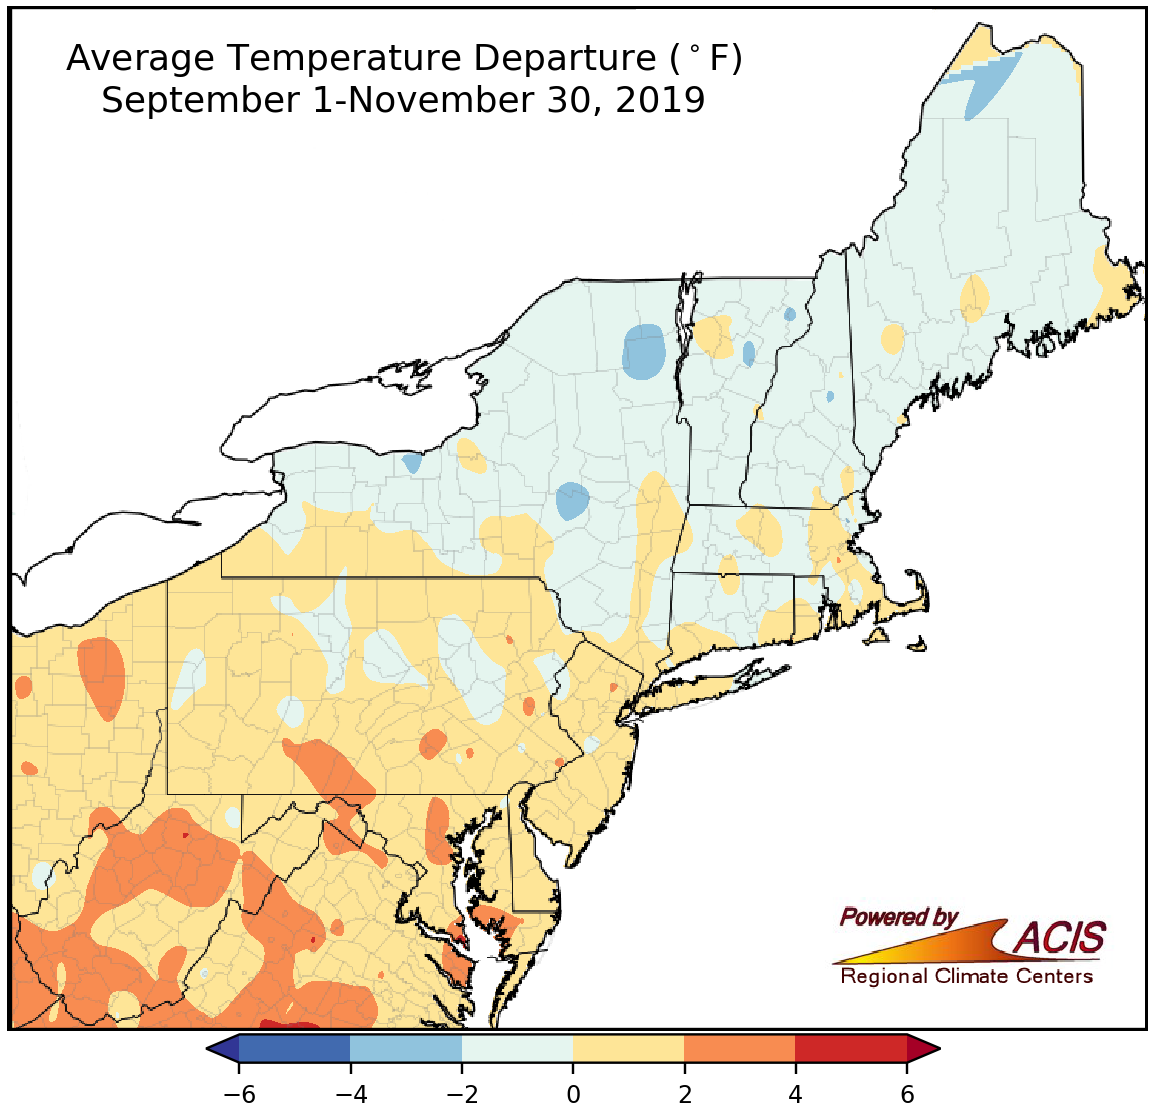
Fall average temperatures ranged from 4°F below normal to 4°F above normal.
A (mostly) mild September, warm October, and cold November averaged out so that the fall season was within 2°F of normal for much of the region. However, there were some locations in southern parts of the region that were as much as 4°F warmer than normal. At the major climate sites, average temperatures ranged from 0.8°F below normal in Worcester, MA, and Concord, NH, to 3.3°F above normal in Baltimore, MD. Binghamton, NY, had its 20th coldest fall on record, while 11 major climate sites ranked this fall among their 20 hottest on record.
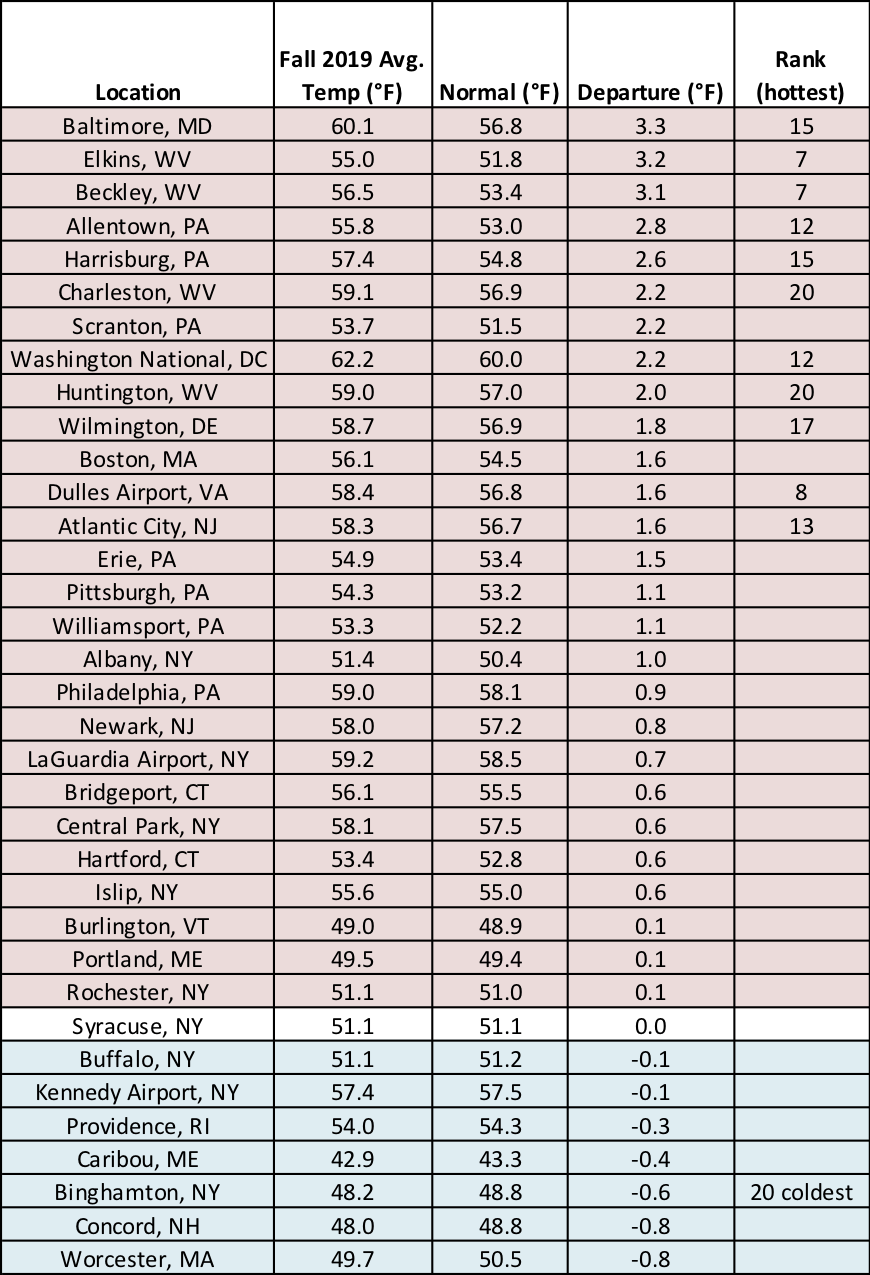
Eleven major climate sites ranked this fall among their 20 hottest on record.
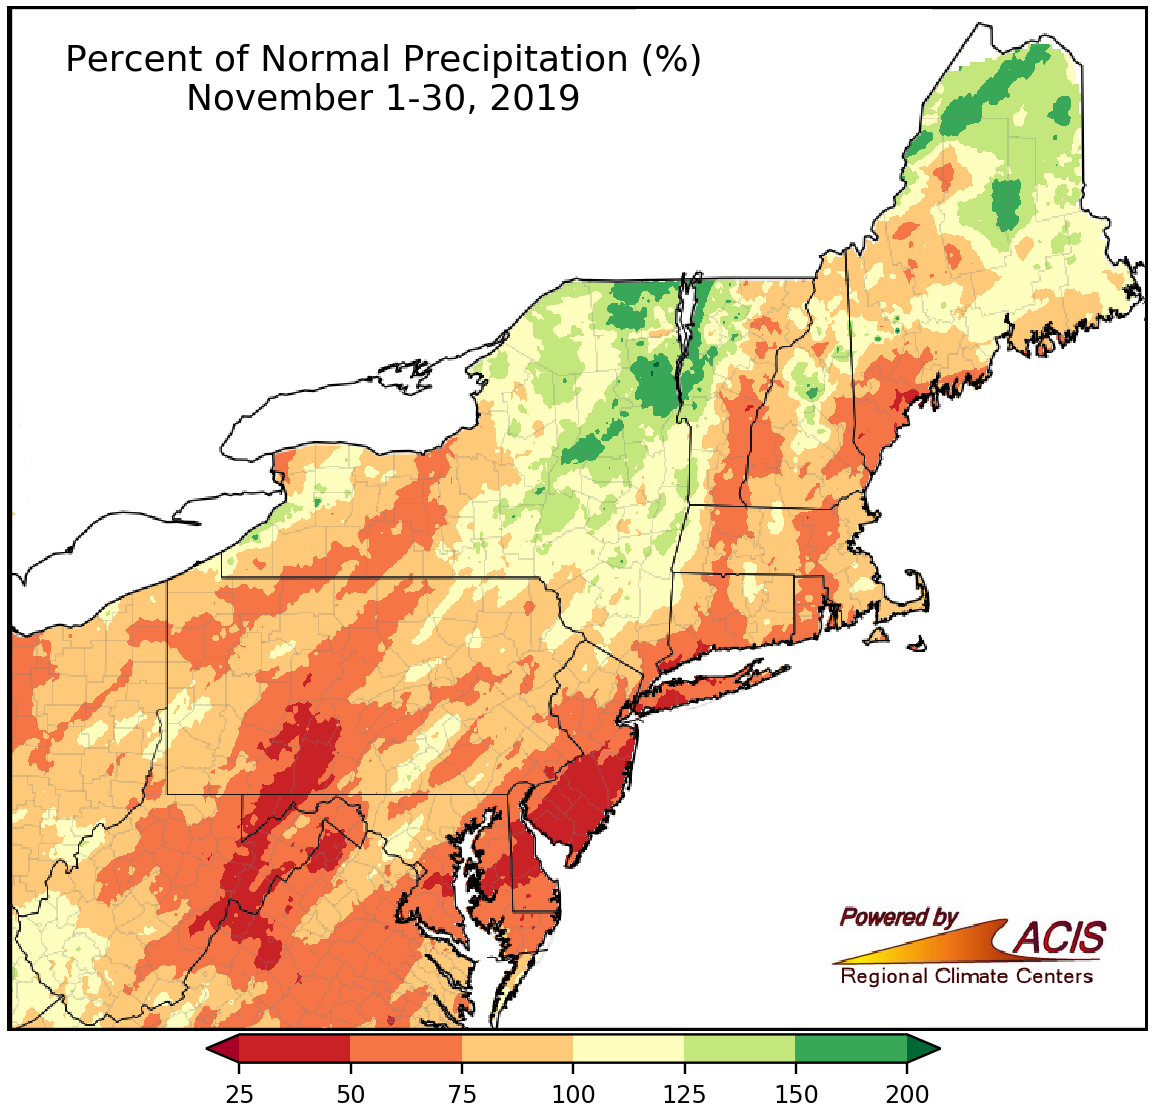
November precipitation ranged from 25% of normal to 200% of normal.
While November precipitation ranged from 25% of normal to 200% of normal, a majority of the region experienced drier-than-normal conditions. Precipitation at the 35 major climate sites ranged from 30% of normal in Bridgeport, CT, to 108% of normal in Burlington, VT, with 14 sites ranking this November among their 20 driest on record. With below-normal precipitation, pockets of abnormal dryness lingered in the region.

Fourteen major climate sites ranked this November among their 20 driest on record.
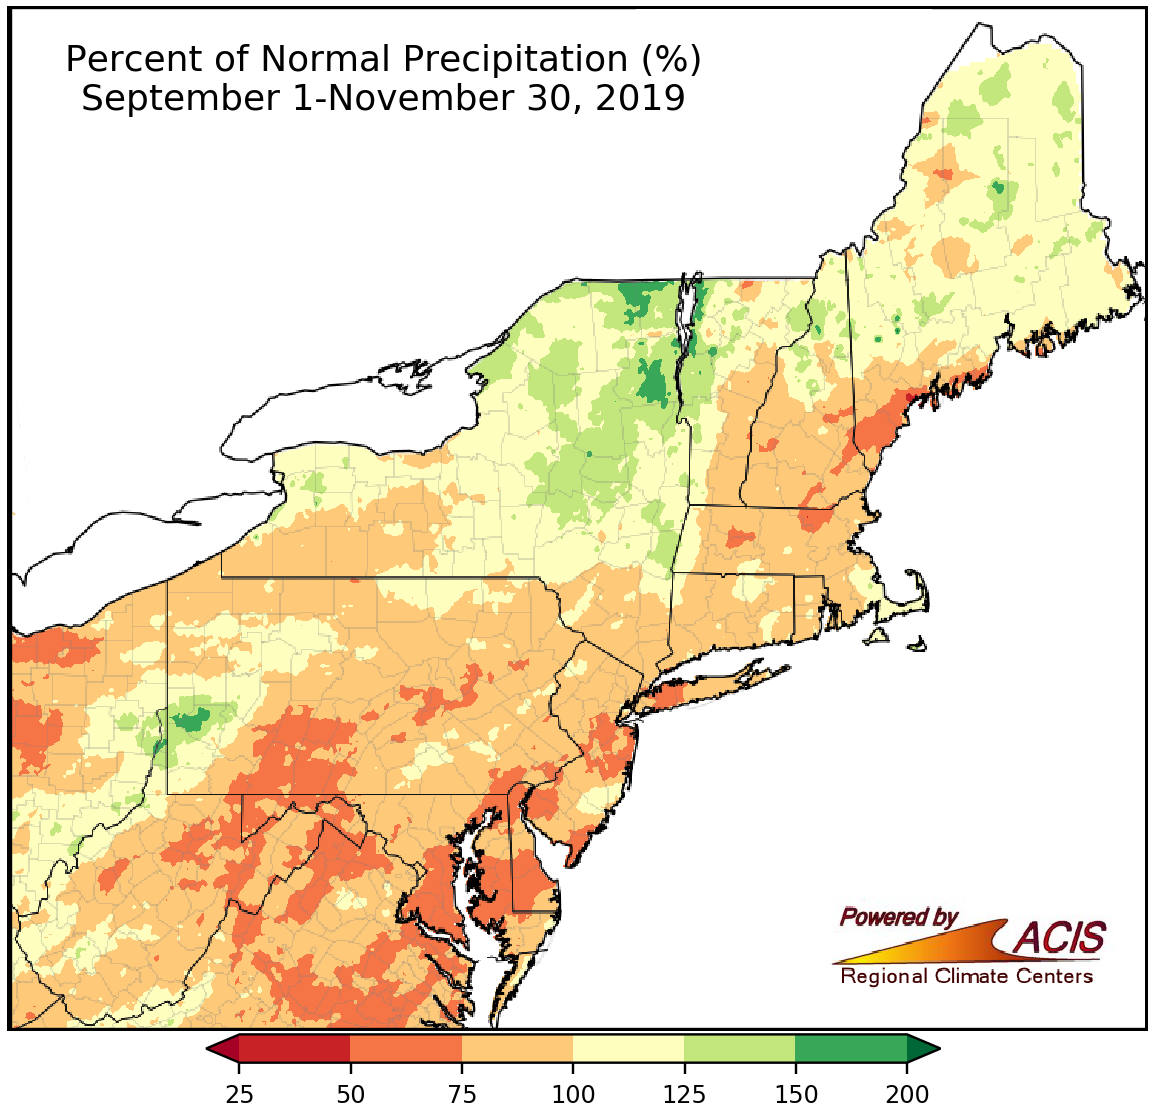
Fall precipitation ranged from 50% of normal to 200% of normal.
The Northeast experienced an exceptionally dry September, a soggy October, and a (mostly) drier-than-normal November. With that, fall precipitation ranged from 50% of normal to 150% of normal for most areas. Precipitation at the major climate sites ranged from 62% of normal in Philadelphia, PA, to 164% of normal in Pittsburgh, PA. The season ranked among the 20 driest falls on record for two sites and among the 20 wettest for five sites.
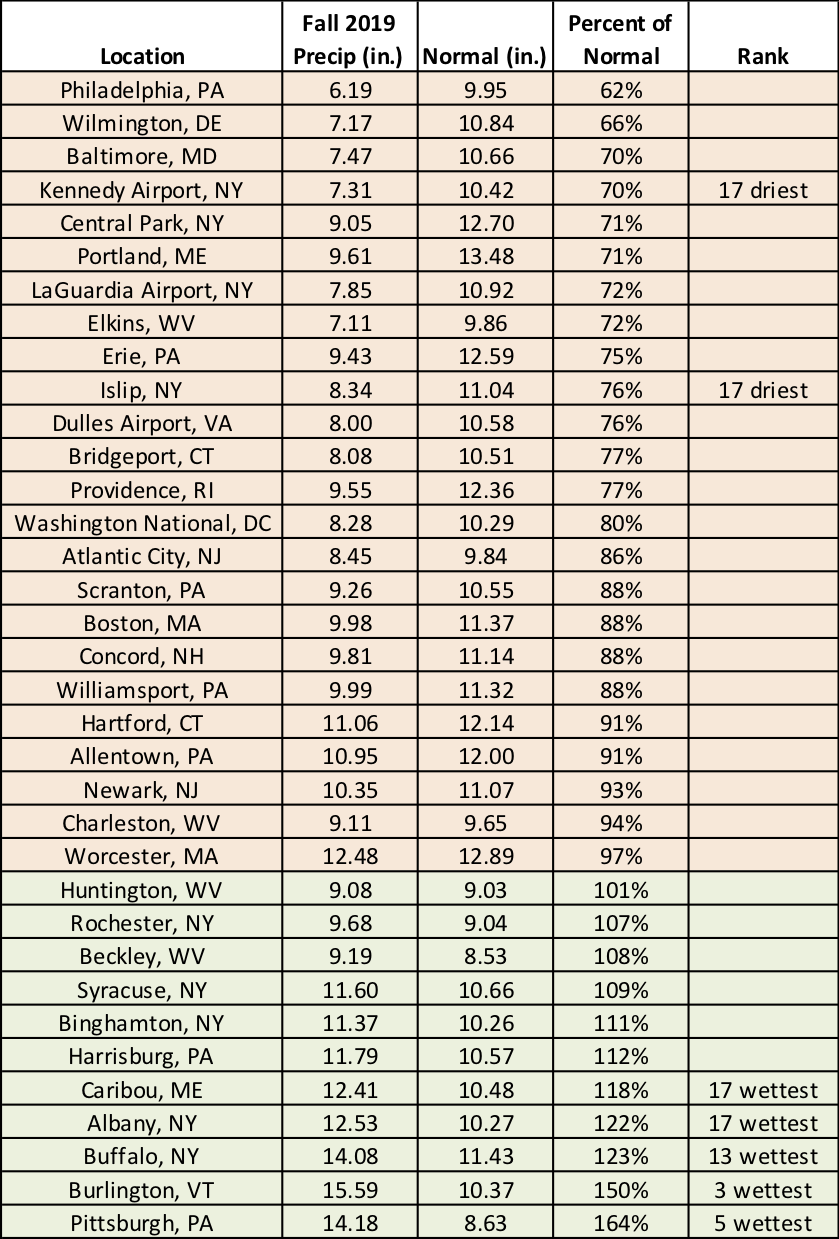
This fall ranked among the 20 driest on record for two sites and among the 20 wettest for five sites.
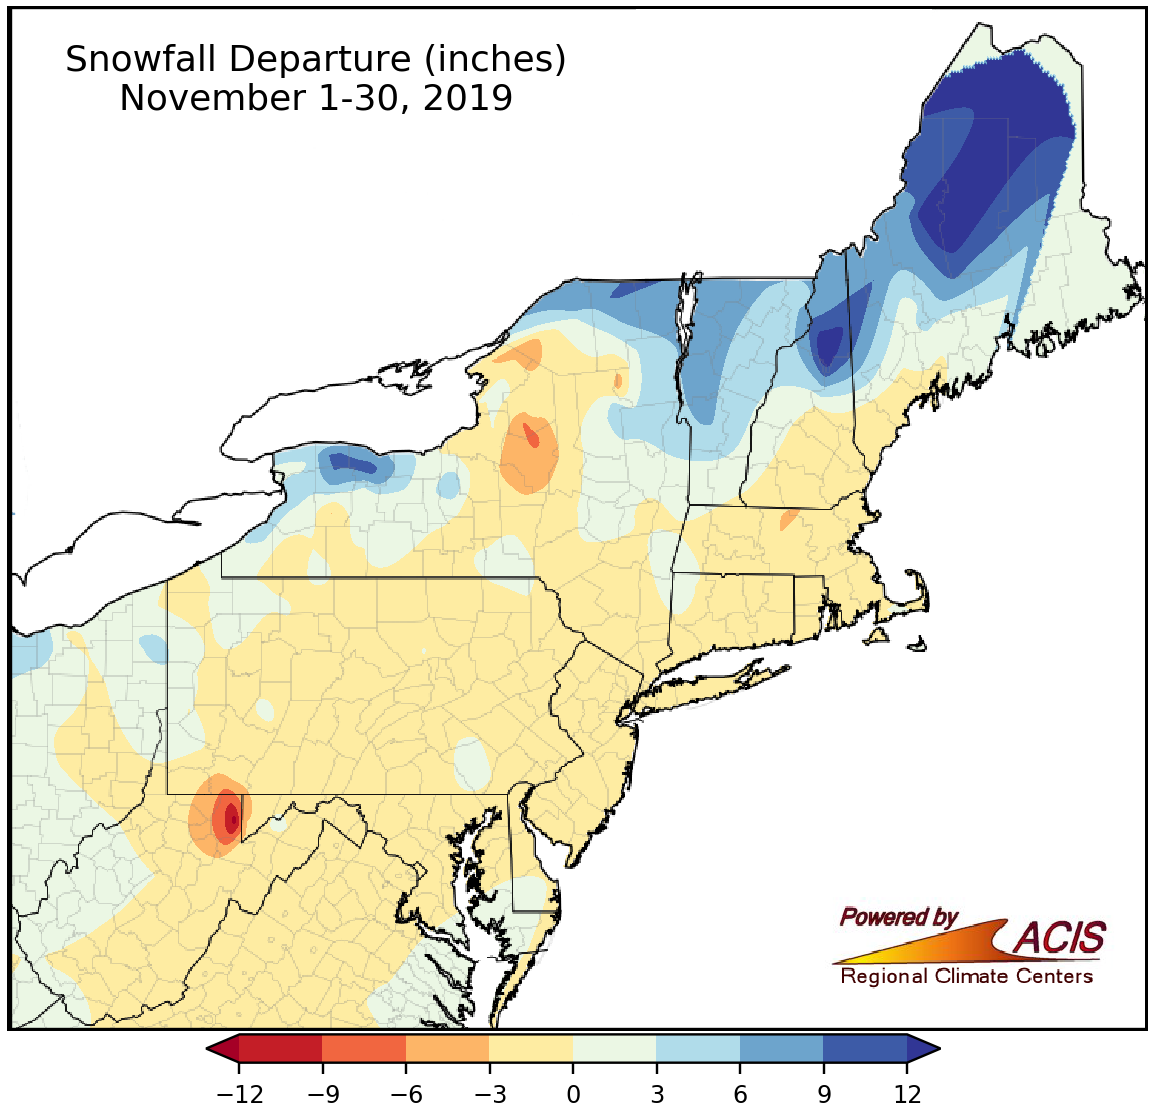
November snowfall ranged from more than 6 inches below normal to more than 12 inches above normal.
November snowfall ranged from more than 6 inches below normal to more than 12 inches above normal. The largest deficits were found in the higher elevations of northern West Virginia and lake-effect areas east of Lake Ontario in New York, while the greatest surpluses were in the northern half of Maine and higher elevations of northern New Hampshire. Snowfall at the 35 major climate sites ranged from 2.9 inches below normal in Syracuse, NY, to 12.5 inches above normal in Caribou, ME, with four sites ranking this November among their 20 snowiest on record.
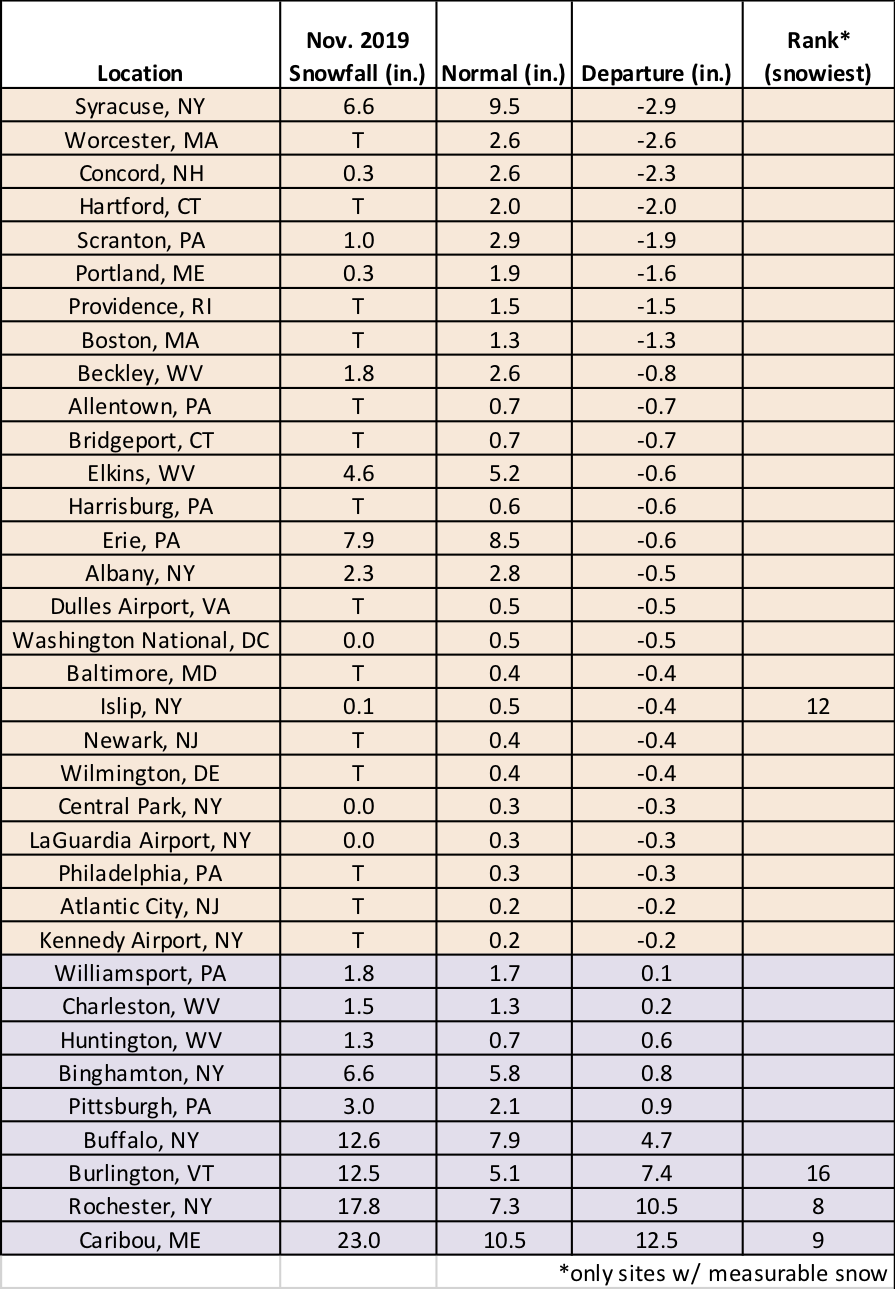
Four major climate sites ranked this November among their 20 snowiest on record.
December could be wet and warm for parts of the region, based on the outlooks from NOAA’s Climate Prediction Center. There’s a slight tilt towards above-normal precipitation for portions of the Northeast, which are shaded green in the map below. In addition, areas shaded orange in the map below have an increased likelihood of experiencing a warmer-than-normal December.
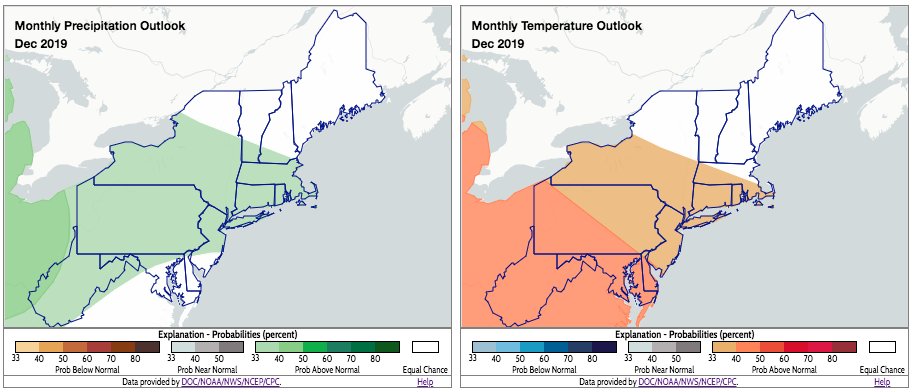
CPC’s precipitation and temperature outlooks for December. Click to enlarge.