April So Far - Lots of Warmth but Limited Showers
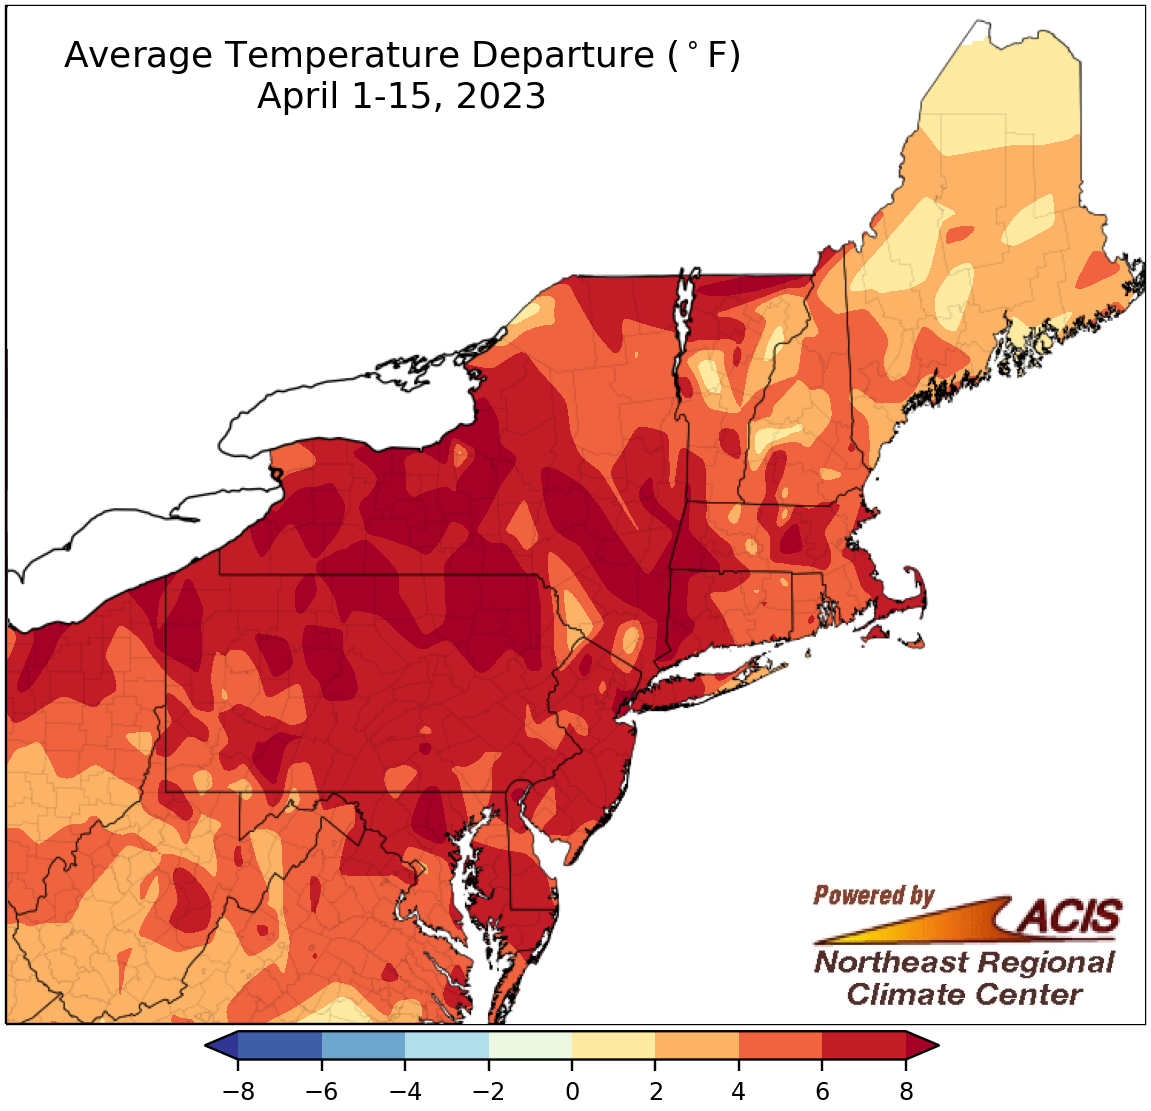
April 1-15 average temperatures ranged from near normal to more than 8°F above normal.
The first half of April was warmer than normal in the Northeast, with average temperatures ranging from near normal to more than 8°F above normal. Many days during the first two weeks of the month were warmer than normal, particularly April 13 and 14. Highs on those days soared into the 70s, 80s, and 90s at multiple sites, with some seeing one of their 10 highest temperatures for April. For instance, Hartford, CT, reached 96°F on the 14th, tying its warmest April temperature. Meanwhile, Worcester, MA, recorded a 90°F day in April for only the fifth time on record. April 1-15 average temperatures at the Northeast’s 35 major climate sites ranged from 0.8°F above normal in Caribou, ME, to 11.4°F above normal in Binghamton, NY. This first half of April was record warm for Baltimore, MD; Wilmington, DE; and Washington, D.C. It ranked among the five warmest on record for another 24 major climate sites and among the 20 warmest for six more of the sites.
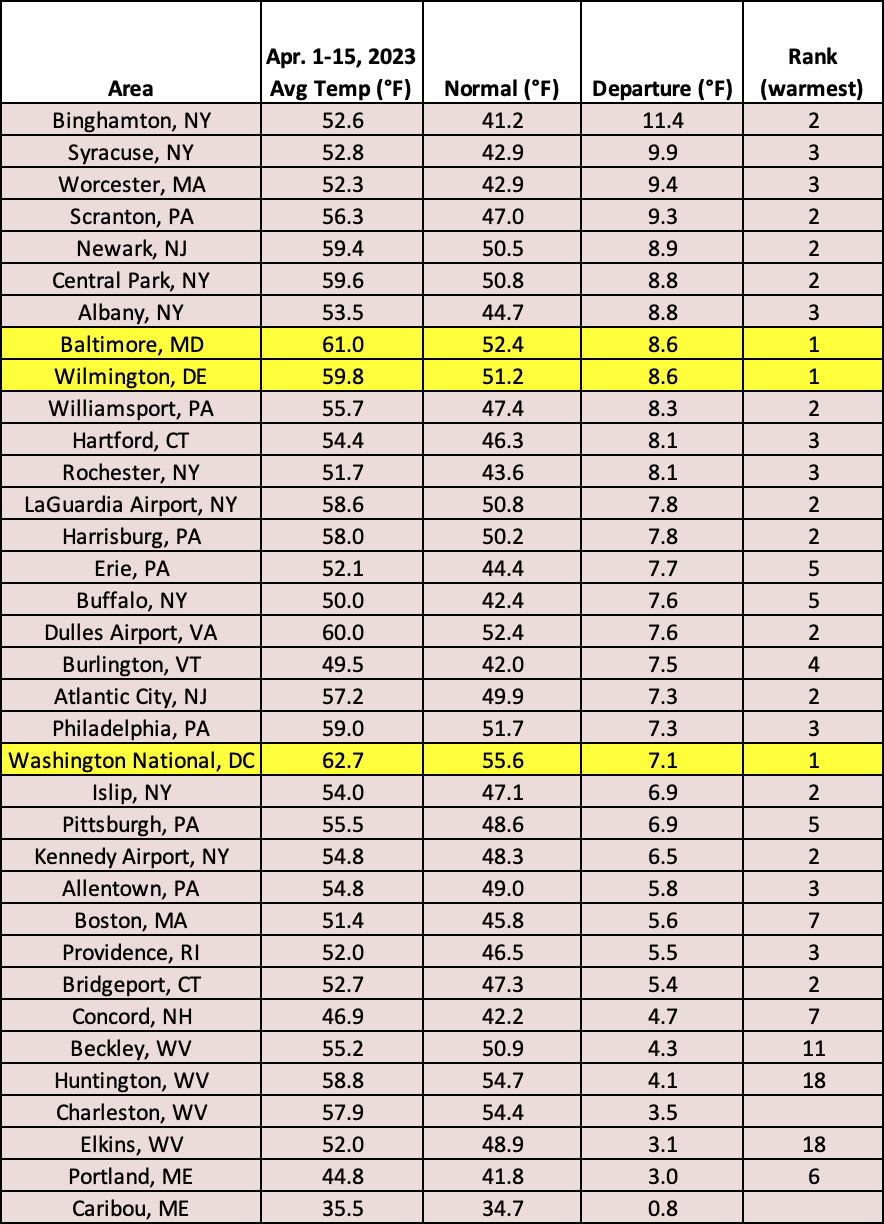
This first half of April was record warm for three major climate sites and among the 20 warmest on record for another 30 of the sites.
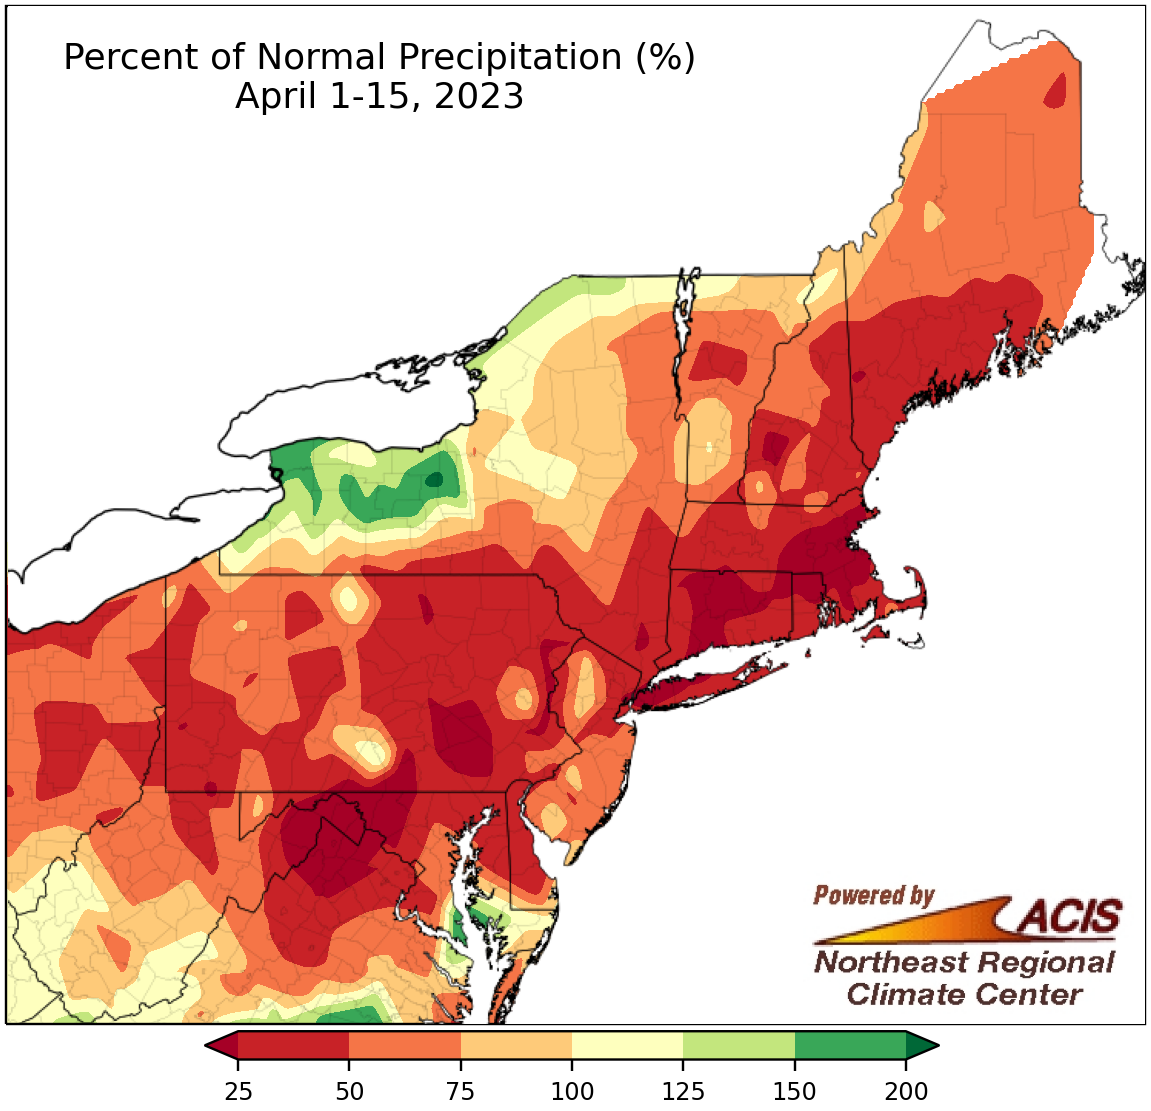
April 1-15 precipitation ranged from less than 25% of normal to 200% of normal.
A majority of the Northeast was drier than normal during the first half of April, with the driest areas seeing less than 25% of normal precipitation. However, a few areas, particularly near the Great Lakes in New York, were wetter than normal. April 1-15 precipitation at the 35 major climate sites ranged from 15% of normal at Kennedy Airport, NY, to 140% of normal in Buffalo, NY, with 31 of the sites being on the dry side of normal. This first half of April ranked among the 20 driest on record for 21 of the sites but was Buffalo’s 20th wettest. With below-normal precipitation, declining streamflow and groundwater levels, reduced soil moisture, and an uptick in wildfires, moderate drought and abnormal dryness expanded in the region.
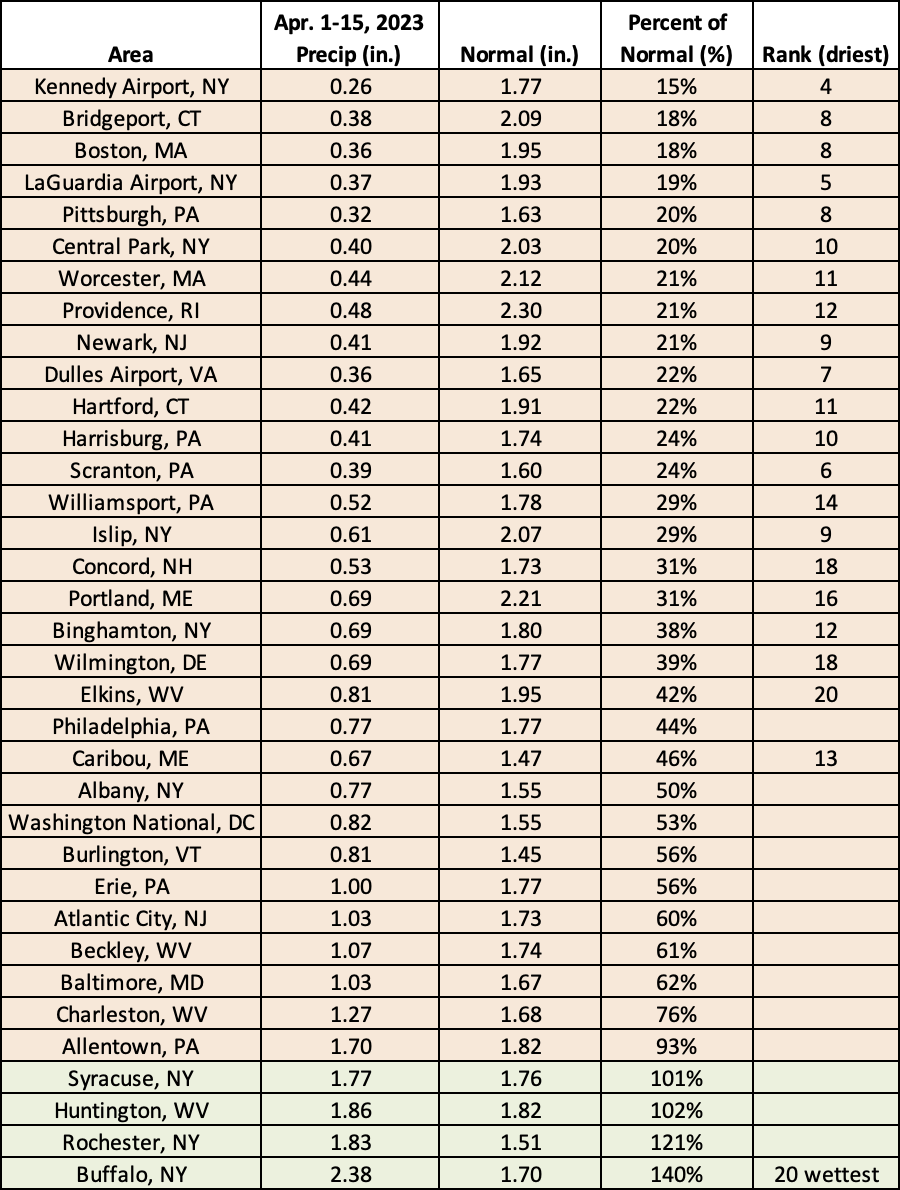
This first half of April was among the 20 driest on record for 21 major climate sites but ranked as Buffalo, NY’s 20th wettest.
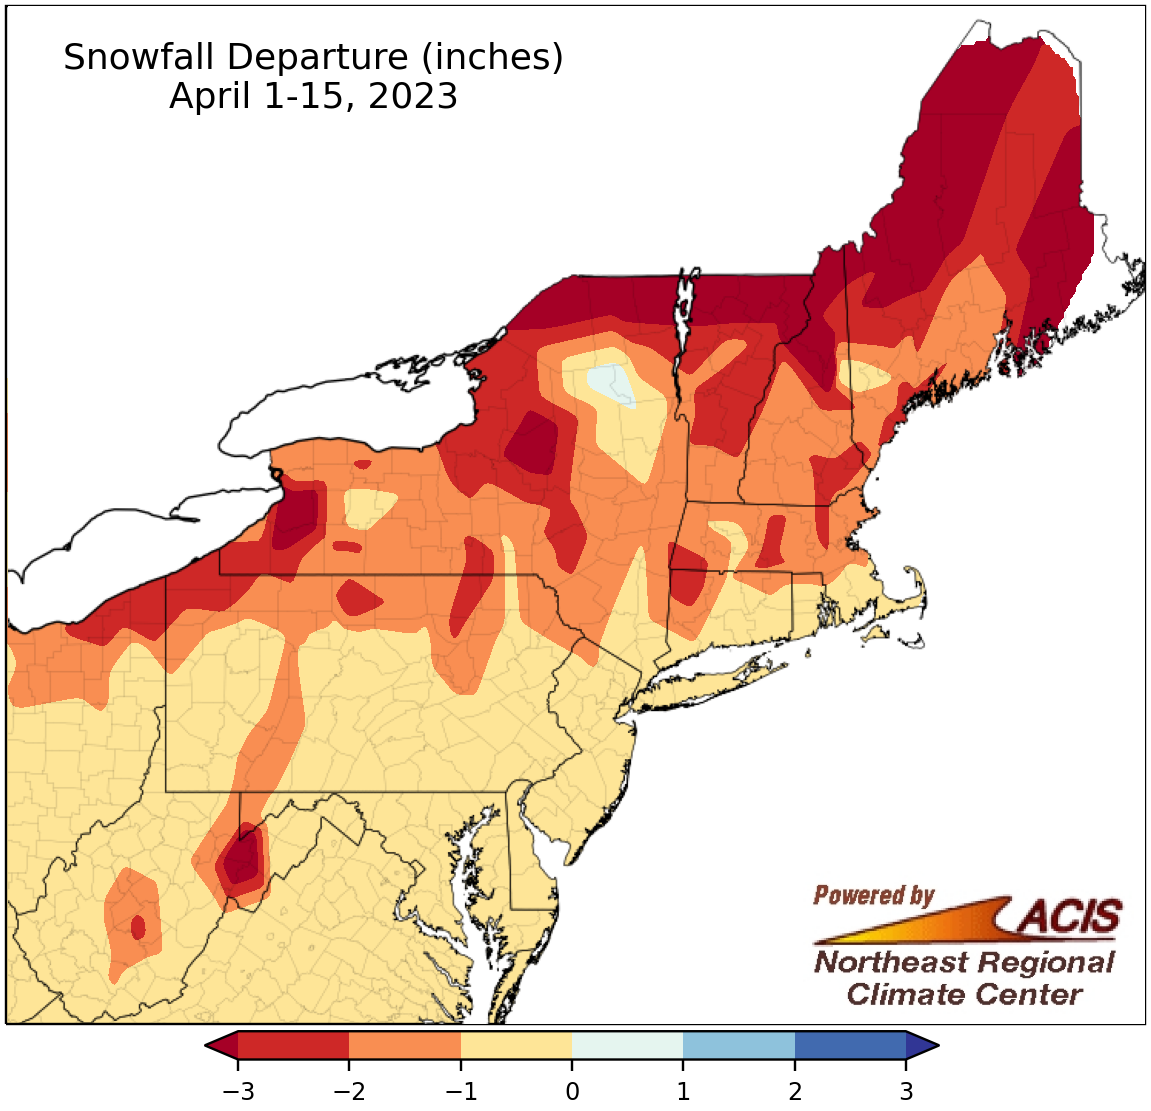
Snowfall from April 1-15 ranged from more than 3 inches below normal to near normal.
With above-normal temperatures and below-normal precipitation, snowfall was limited during the first half of April. The largest deficits over over 3 inches were found in portions of New York and northern New England. At the 35 major climate sites, April 1-15 snowfall ranged from 2.8 inches below normal in Burlington, VT, to normal in Baltimore, MD, and Washington, D.C. Only two major climate sites, Caribou, ME, and Binghamton, NY, recorded measurable snowfall, with Binghamton seeing its 13th least snowy April 1-15 period.
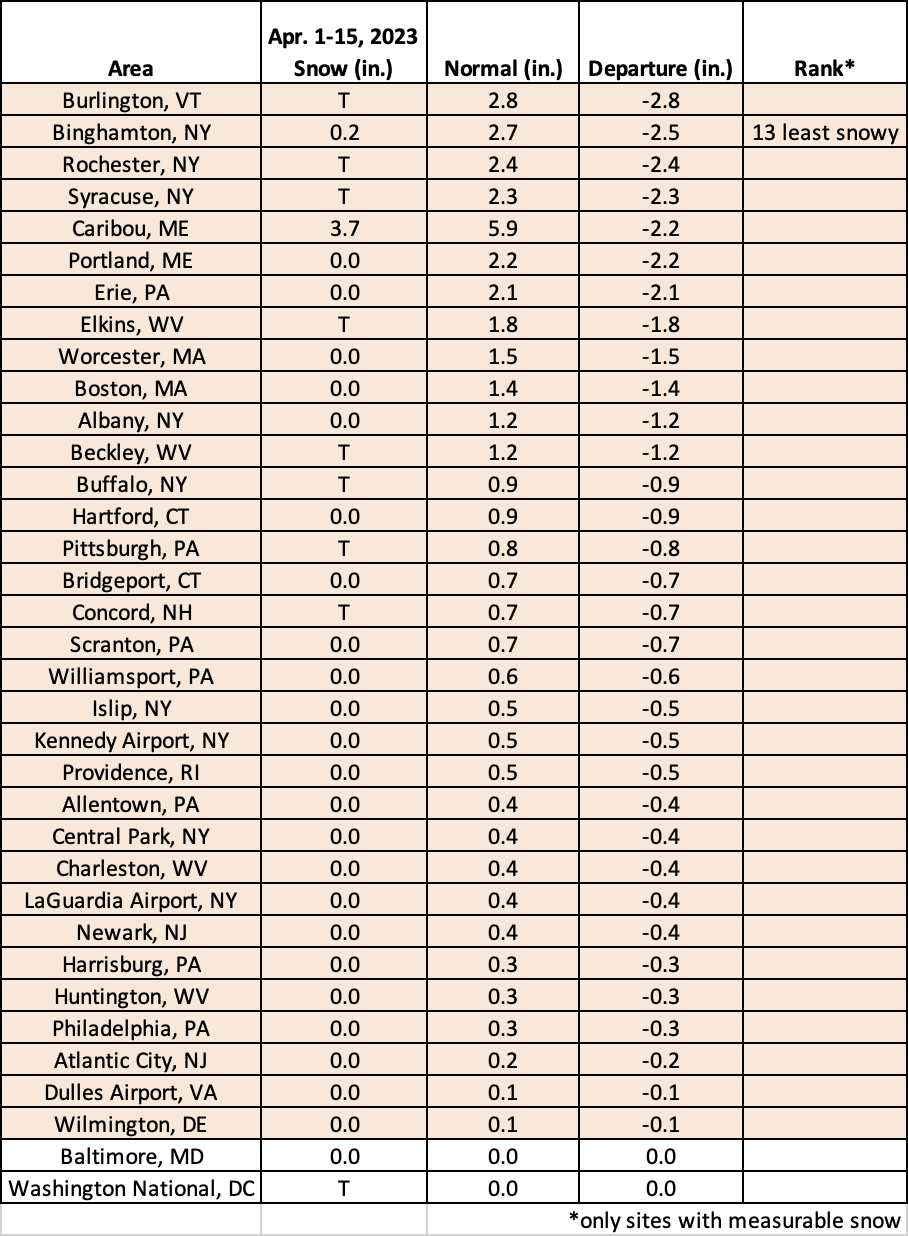
Only two major climate sites saw measurable snowfall from April 1-15, with Binghamton, NY, having its 13th least snowy first half of April.
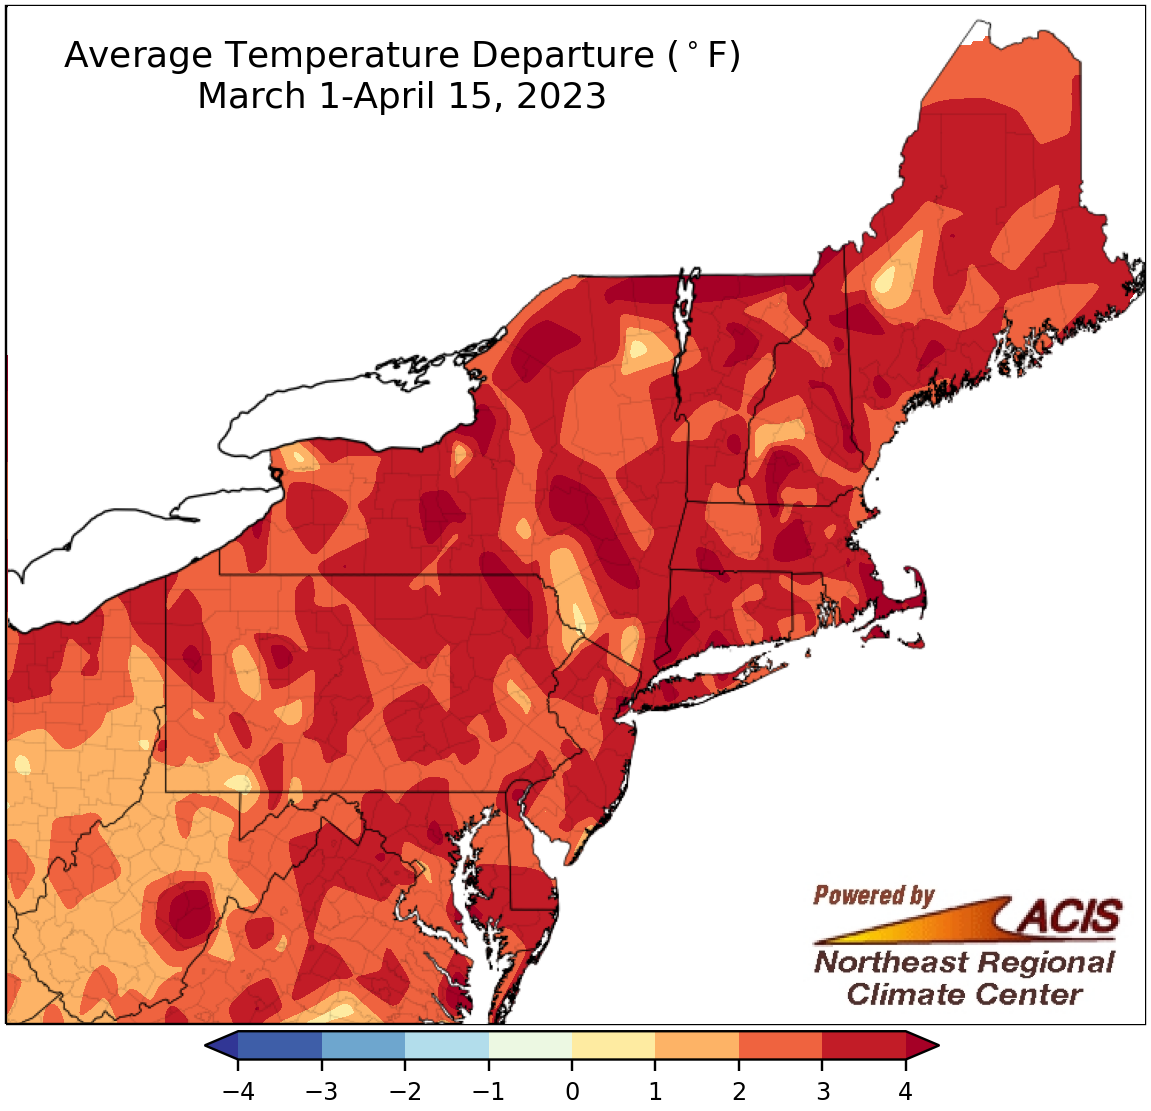
March 1-April 15 average temperatures ranged from near normal to more than 4°F above normal.
The first half of spring has also been warmer than normal, with average temperatures ranging from near normal to more than 4°F above normal. March 1-April 15 average temperatures at the 35 major climate sites ranged from 1.2°F above normal in Charleston, WV, to 5.3°F above normal in Worcester, MA, with this first half of spring ranking among the 20 warmest on record at 31 of the sites.
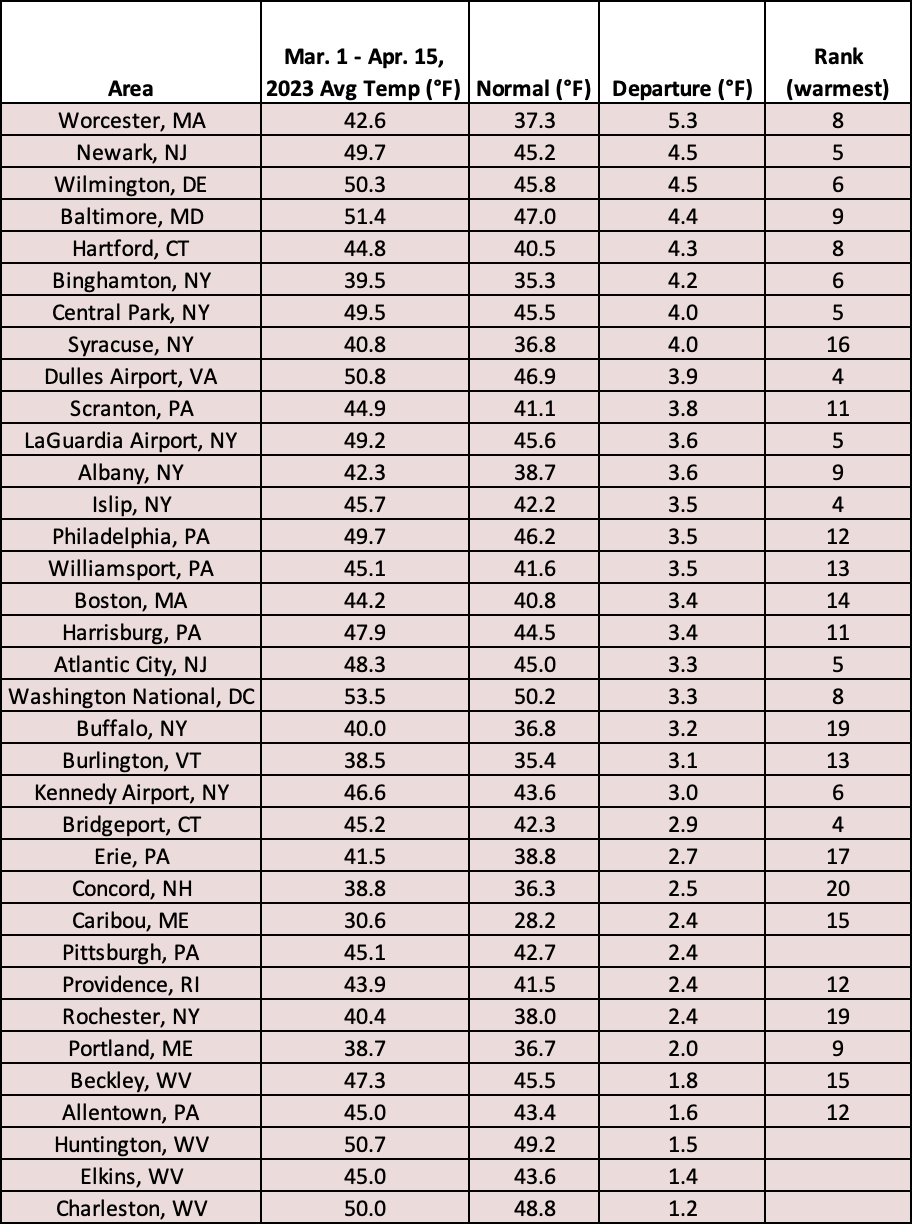
This first half of spring ranked among the 20 warmest on record for 31 major climate sites.
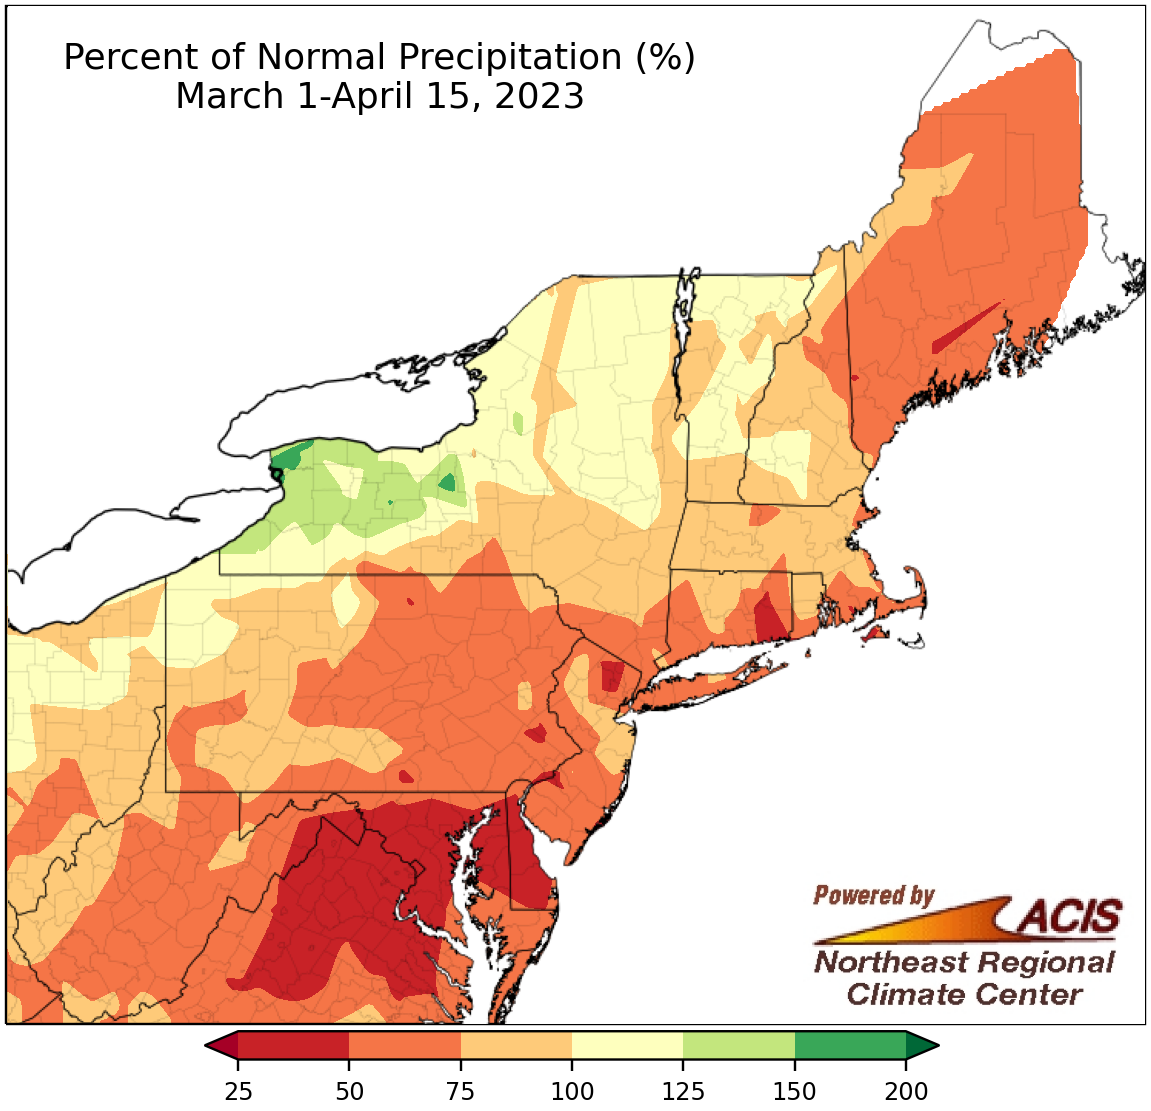
Precipitation during the first half of spring ranged from 25% of normal to 150% of normal.
Similar to the first half of April, the first half of spring also featured below-normal precipitation for a large chunk of the Northeast. The driest locations, generally in the southeastern corner of the region, saw less than 50% of normal precipitation. Meanwhile, some interior locations, particularly western New York, saw over 125% of normal precipitation. At the 35 major climate sites, March 1-April 15 precipitation ranged from 37% of normal at Dulles Airport, VA, to 140% of normal in Buffalo, NY, with 30 of the sites being drier than normal. This first half of spring was among the 20 driest for 16 major climate sites but was Buffalo’s 10th wettest.
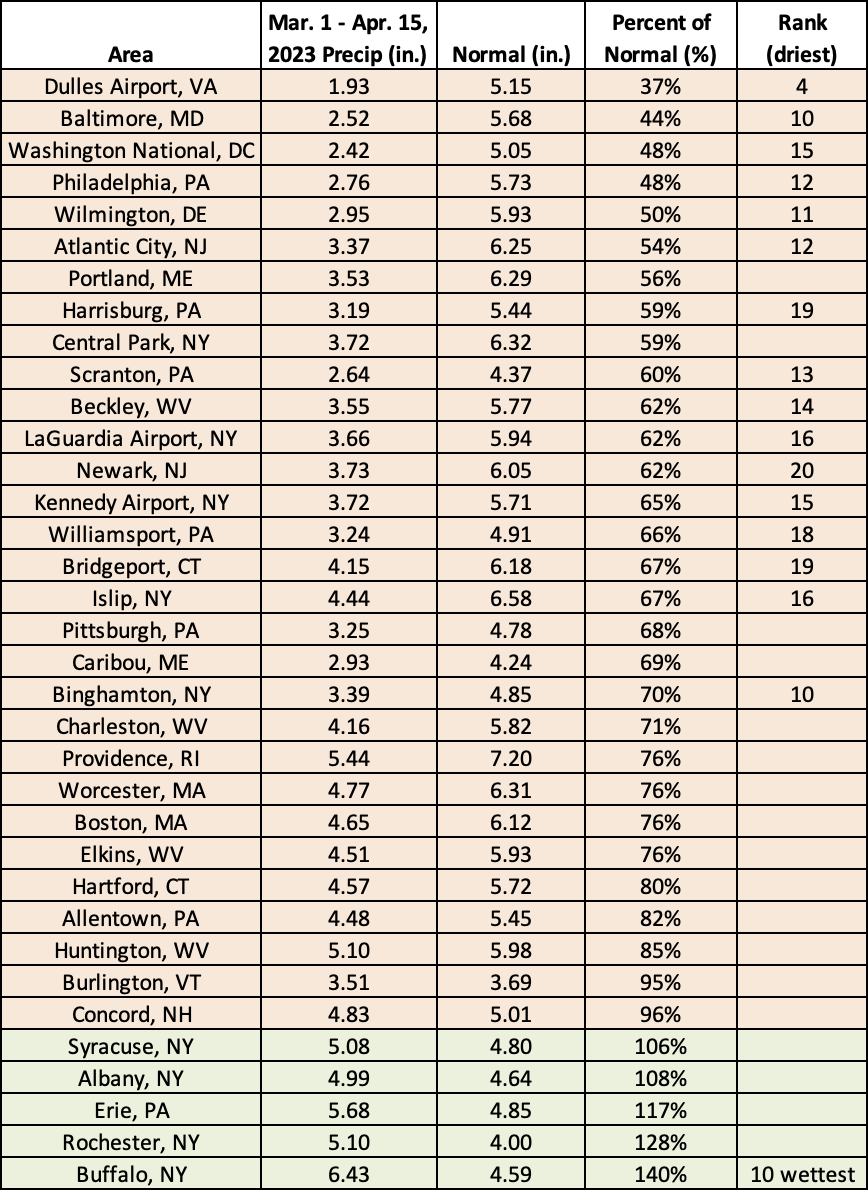
This first half of spring ranked among the 20 driest on record for 16 major climate sites but was Buffalo, NY’s 10th wettest.
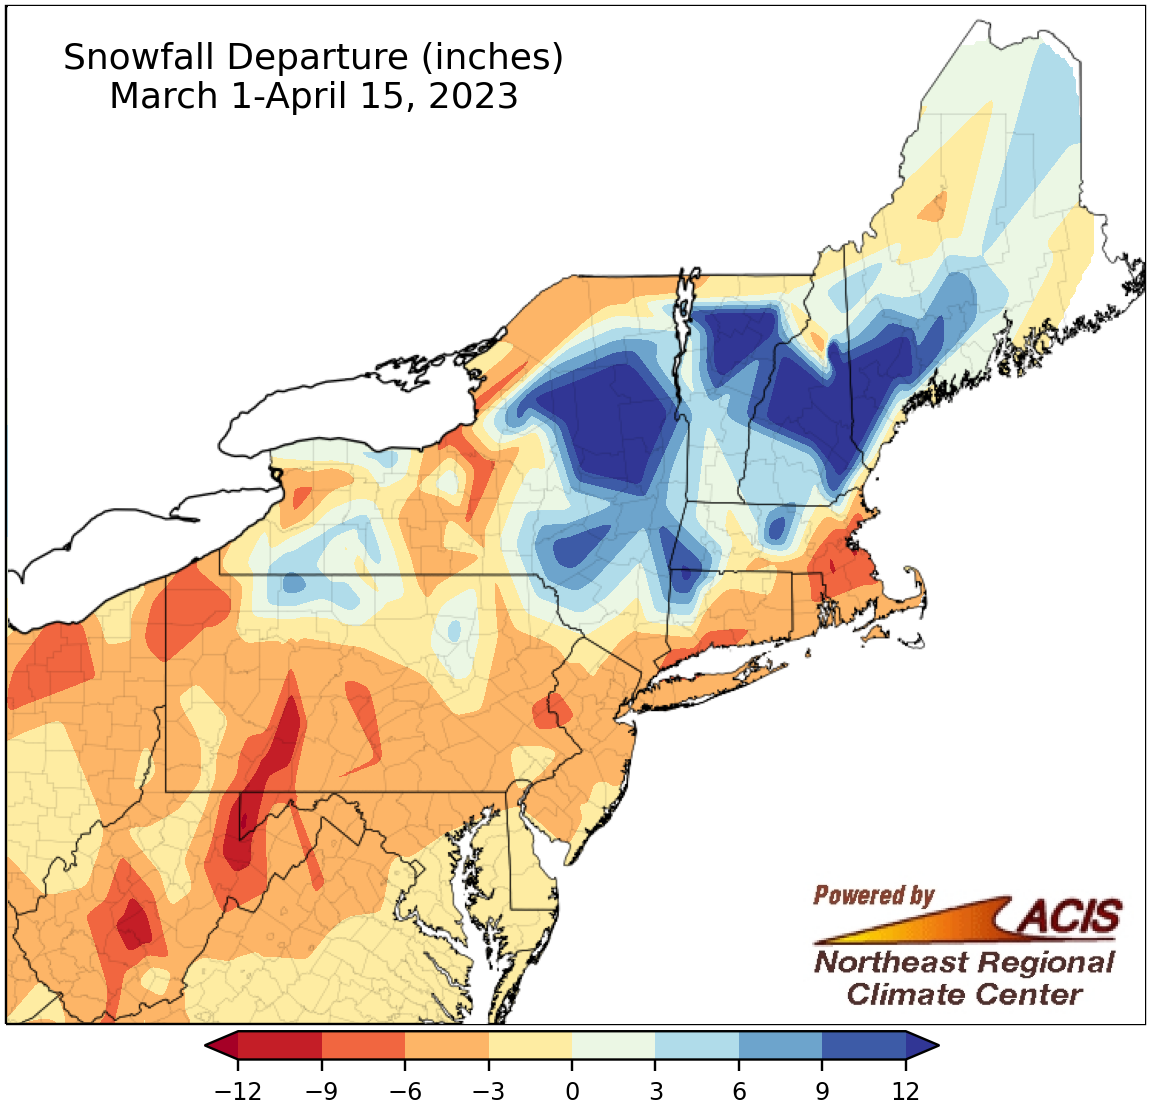
Snowfall from March 1-April 15 ranged from 12 inches below normal to more than 12 inches above normal.
Snowfall during the first half of spring ranged from 12 inches below normal in parts of West Virginia, western Maryland, and southern Pennsylvania to more than 12 inches above normal in parts of northern New York and northern New England, particularly where a mid-March nor’easter dumped heavy snow. March 1-April 15 snowfall at the 35 major climate sites ranged from 9.5 inches below normal in Boston, MA, to 7.8 inches above normal in Albany, NY, with 29 sites seeing below-normal snowfall. This first half of spring ranked among the 20 least snowy for seven major climate sites.
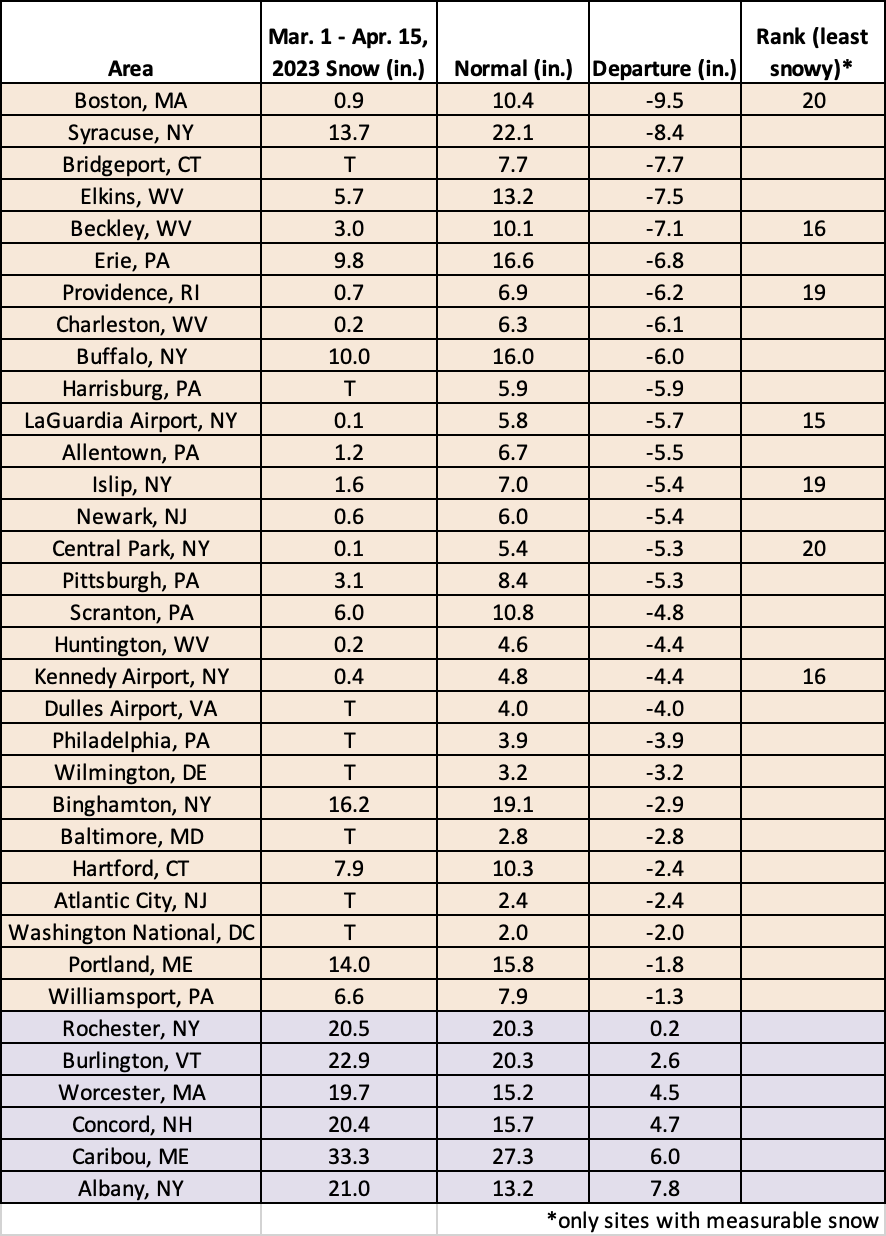
This March 1-April 15 period ranked among the 20 least snowy for seven major climate sites.