Summer Falls Into Autumn
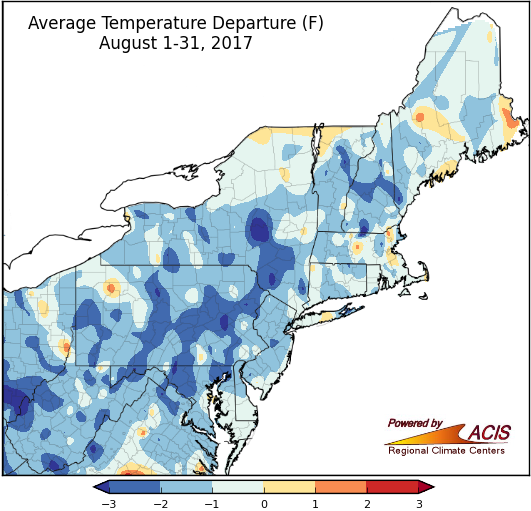
August average temperatures generally ranged from more than 3°F below normal to 1°F above normal.
The last month of meteorological summer was a cool one for the Northeast, with average temperatures ranging from 3°F below normal to normal for most areas. Thirty-two of the region’s 35 major climate sites were colder than normal, with Binghamton, NY, Dulles Airport, VA, and Baltimore, MD, ranking this August among their top five coldest on record.
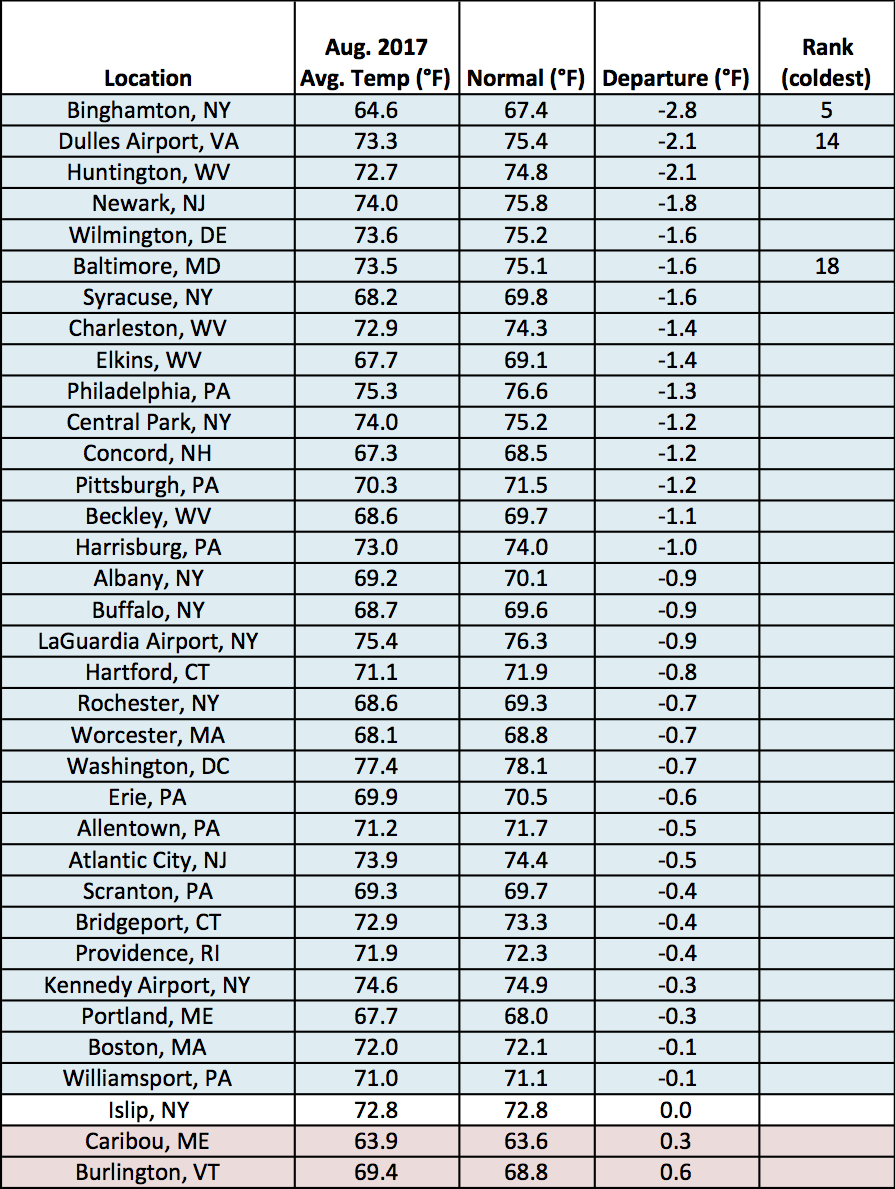
Average temperatures for August at the major climate sites ranged from 2.8°F below normal in Binghamton, NY, to 0.6°F above normal in Burlington, VT.
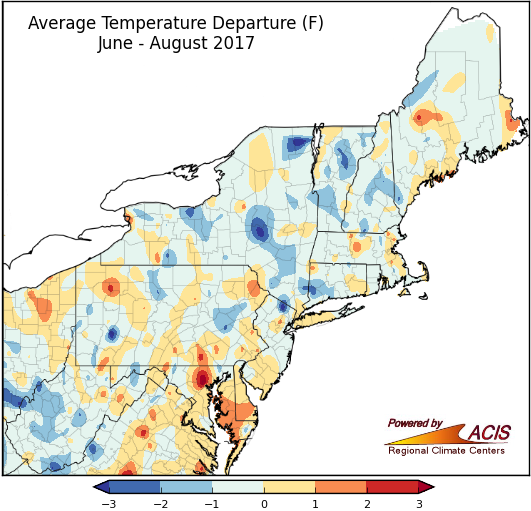
Summer average temperatures ranged from 3°F below normal to 2°F above normal in the region.
There were a few cooler spots that were 2-3°F colder than normal, as well as a few warmer locations that were up to 2°F warmer than normal, but overall summer averaged out to be within 1°F of normal for a large portion of the region. Of the 35 major climate sites, 19 were warmer than normal, 14 were colder than normal, and two wrapped up the season at normal. Atlantic City, NJ, and Washington, DC, ranked this summer among their top 20 warmest, while Binghamton, NY had its 9th coldest summer on record.
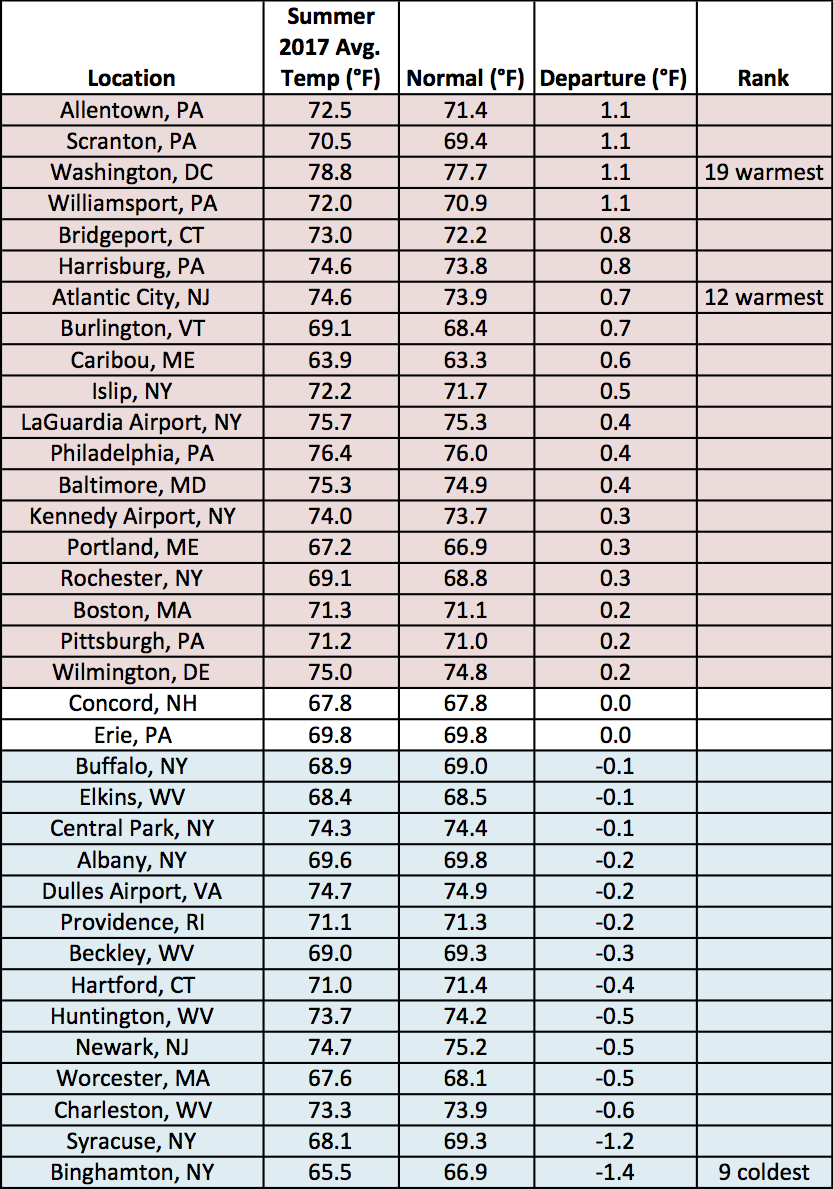
Average temperatures for summer at the major climate sites ranged from 1.4°F below normal in Binghamton, NY, to 1.1°F above normal at four sites.
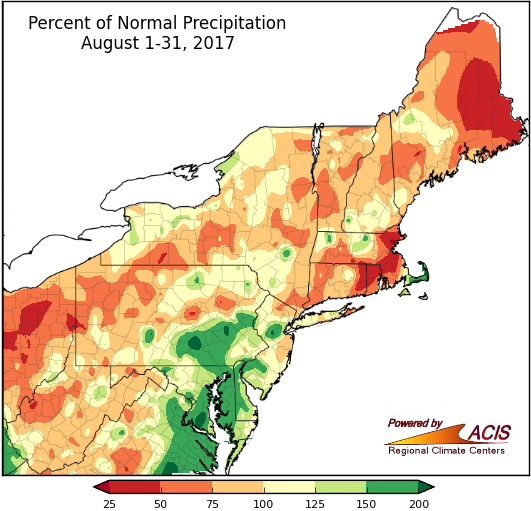
August precipitation ranged from 25% of normal to 200% of normal for most of the Northeast.
August precipitation varied, generally ranging from 25% of normal to 200% of normal. The driest areas were in portions of Maine and southern New England. Abnormal dryness and moderate drought developed in some of these areas during the month. Conversely, the wettest areas were in parts of southeastern Pennsylvania, New Jersey, Delaware, Maryland, and Cape Cod, MA. Twenty-three of the region’s 35 major climate sites were drier than normal, with six ranking this August among their top 20 driest. There were twelve wetter-than-normal sites, with Allentown, PA, having its 10th wettest August on record.
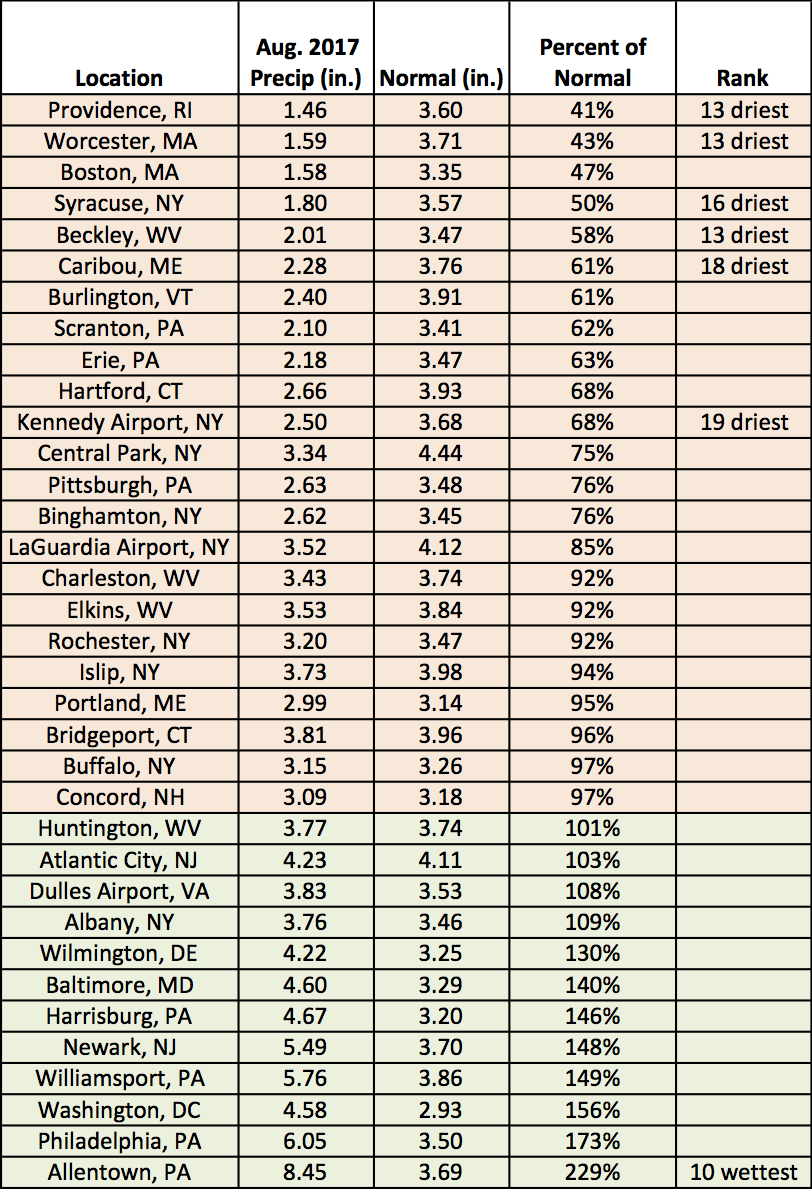
August precipitation at the major climate sites ranged from 41% of normal in Providence, RI, to 229% of normal in Allentown, PA.
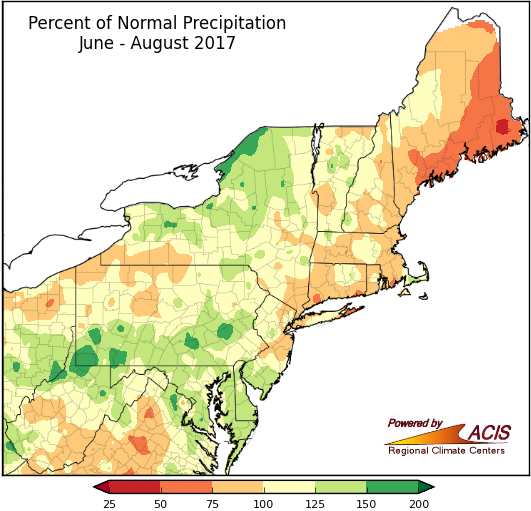
Summer precipitation ranged from 50% of normal to 200% of normal for much of the Northeast.
For summer, precipitation ranged from 50% of normal in eastern Maine to 200% of normal in northern New York, southern Pennsylvania, and northern West Virginia. Of the 22 wetter-than-normal major climate sites, eight ranked this summer among their top 20 wettest. Of the 11 drier-than-normal sites, Caribou, ME, had its 13th driest summer on record.
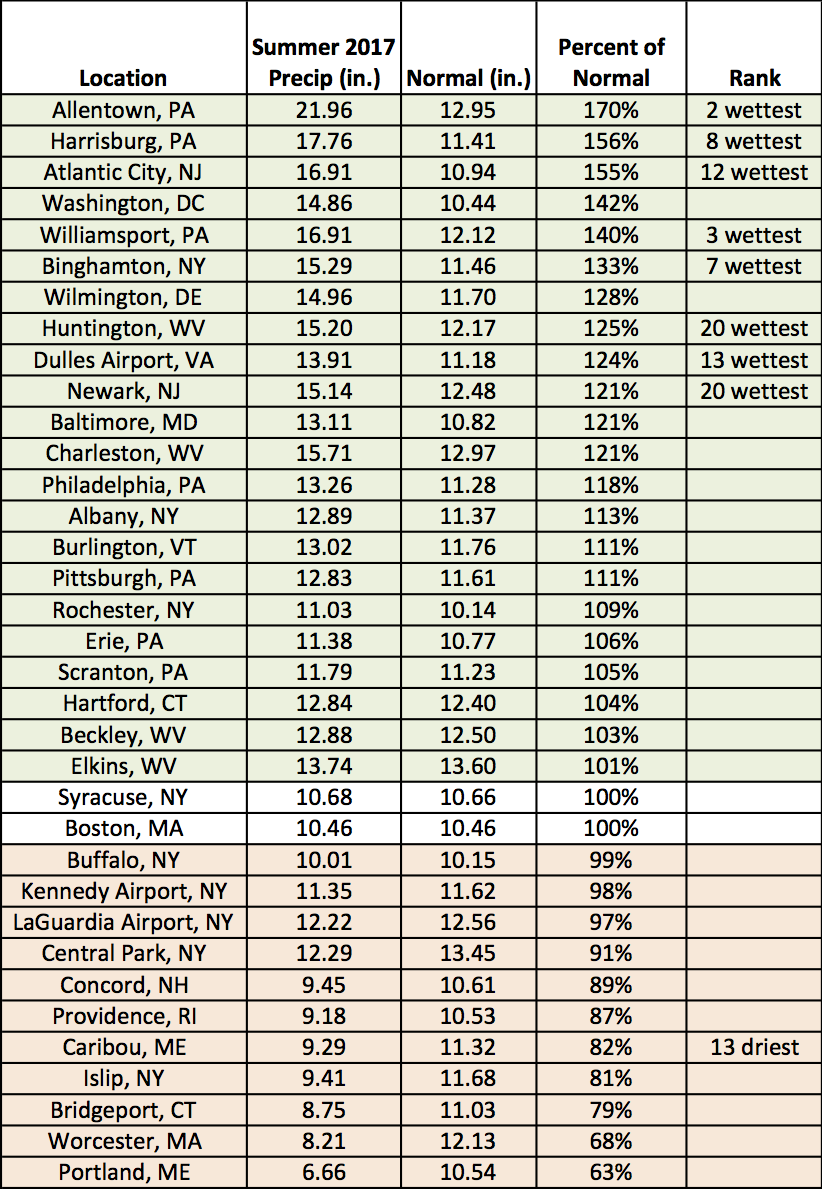
Precipitation for summer at the major climate sites ranged from 63% of normal in Portland, ME, to 170% of normal in Allentown, PA.
September may end up similar to August based on NOAA’s Climate Prediction Center’s (CPC) outlooks. For September, they are predicting increased chances of below-normal temperatures and above-normal precipitation for much of the region. The main exception is portions of New England where either equal chances or above-normal temperatures were indicated. The autumn (September through November) temperature outlook shows above-normal temperatures are favored for the region, while the autumn precipitation outlook indicates equal chances of below-, near-, or above-normal precipitation.
CPC’s temperature outlook for September indicates increased chances of below-normal temperatures for most of the Northeast, except parts of New England.
The September precipitation outlook from CPC indicates there are increased odds of above-normal precipitation for the entire region.