June Rainfall - From One Extreme to the Other
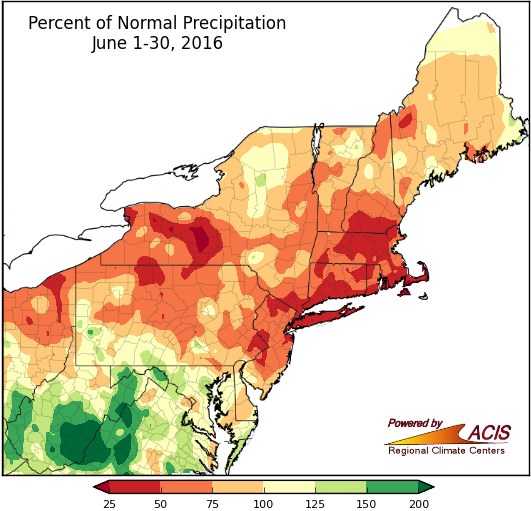
A majority of the region received less than 125% of normal rainfall in June.
June rainfall ranged from less than 25% of normal in parts of New York’s Finger Lakes region to more than 300% of normal in southeastern West Virginia. Twenty-six of the Northeast’s 35 major climate sites were drier than normal, with 11 ranking the month among their top 20 driest Junes. Conversely, three sites ranked the month among their top 20 wettest, with Beckley, WV having its wettest June on record.
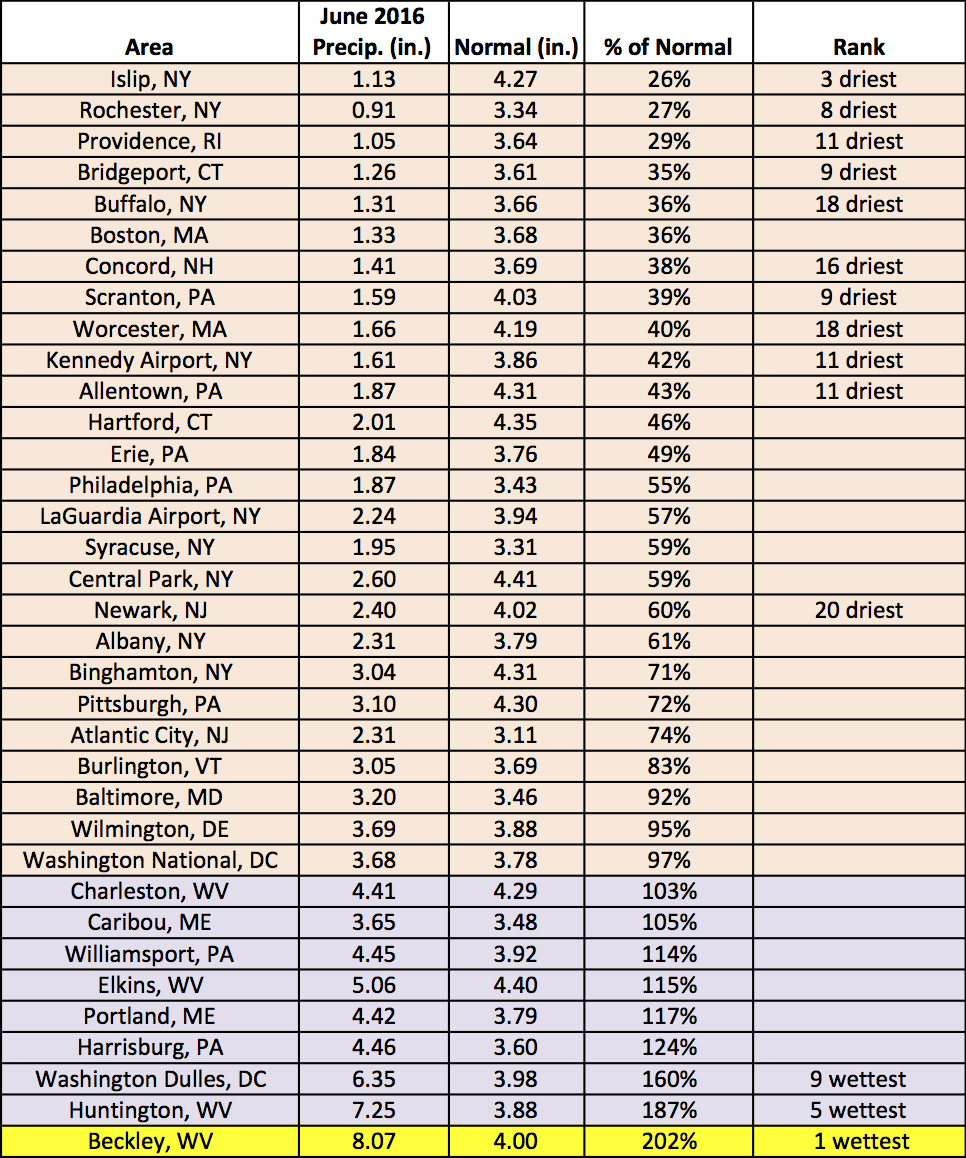
Beckley, WV was record wet for June, while 13 sites saw less than 50% of normal June rainfall.
The lack of rainfall, below normal streamflows, and declining soil moisture led to the expansion/introduction of abnormal dryness and moderate drought conditions in parts of New York, New England, Pennsylvania, and New Jersey. By the end of June, 65% of the region was experiencing either abnormally dry or moderate drought conditions (compared to 39% at the beginning of the month). Above-normal precipitation eased dryness in western Maryland and the Panhandle of West Virginia. In southern West Virginia, record-setting rainfall led to historic flooding.
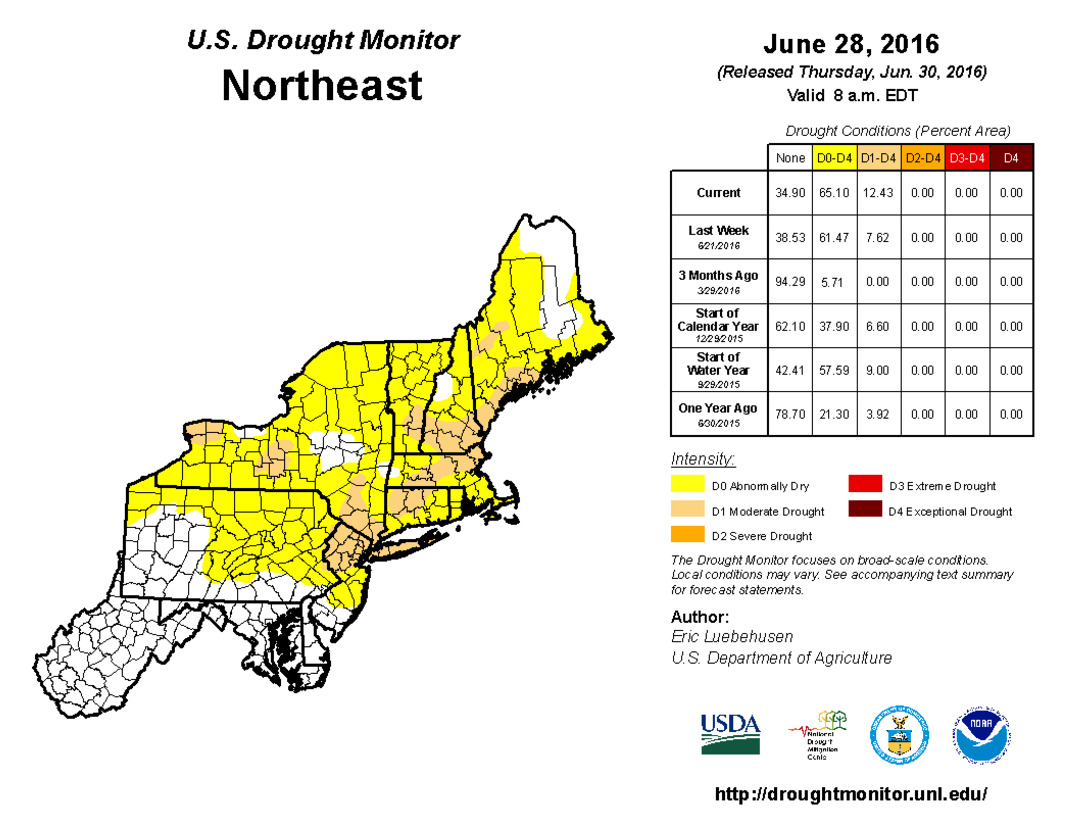
The U.S. Drought Monitor from June 30 shows areas that are abnormally dry (yellow) or in moderate drought (tan). Click to enlarge.
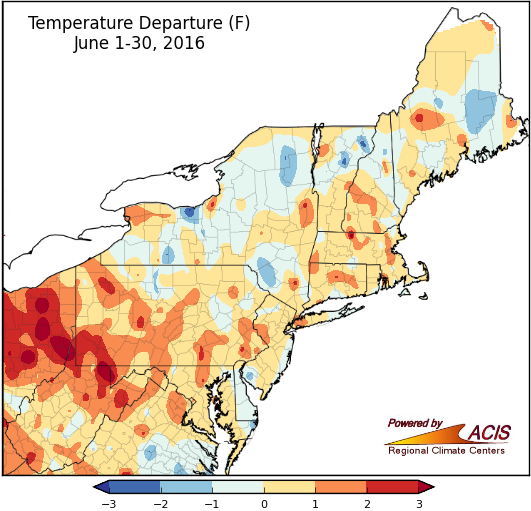
June average temperatures were within 1°F of normal for much of the Northeast.
June temperatures generally ranged from 2°F below normal in parts of New York and northern New England to more than 3°F above normal in parts of northern West Virginia. Thirty-three major climate sites were warmer than normal in June, with six ranking this June among their top 20 warmest.
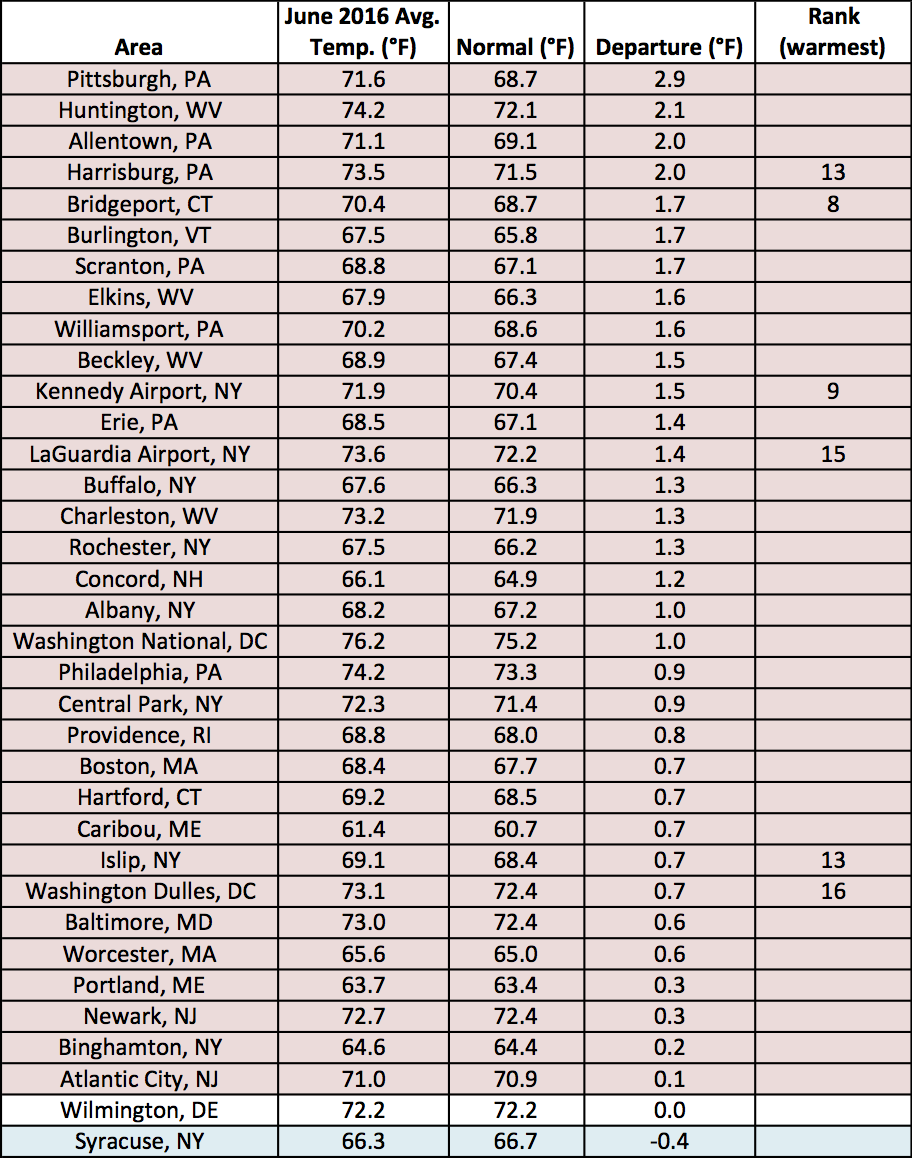
Temperatures at the major climate sites ranged from 0.4°F below normal in Syracuse, NY to 2.9°F above normal in Pittsburgh, PA.