May and Spring - On the Warm Side of Normal
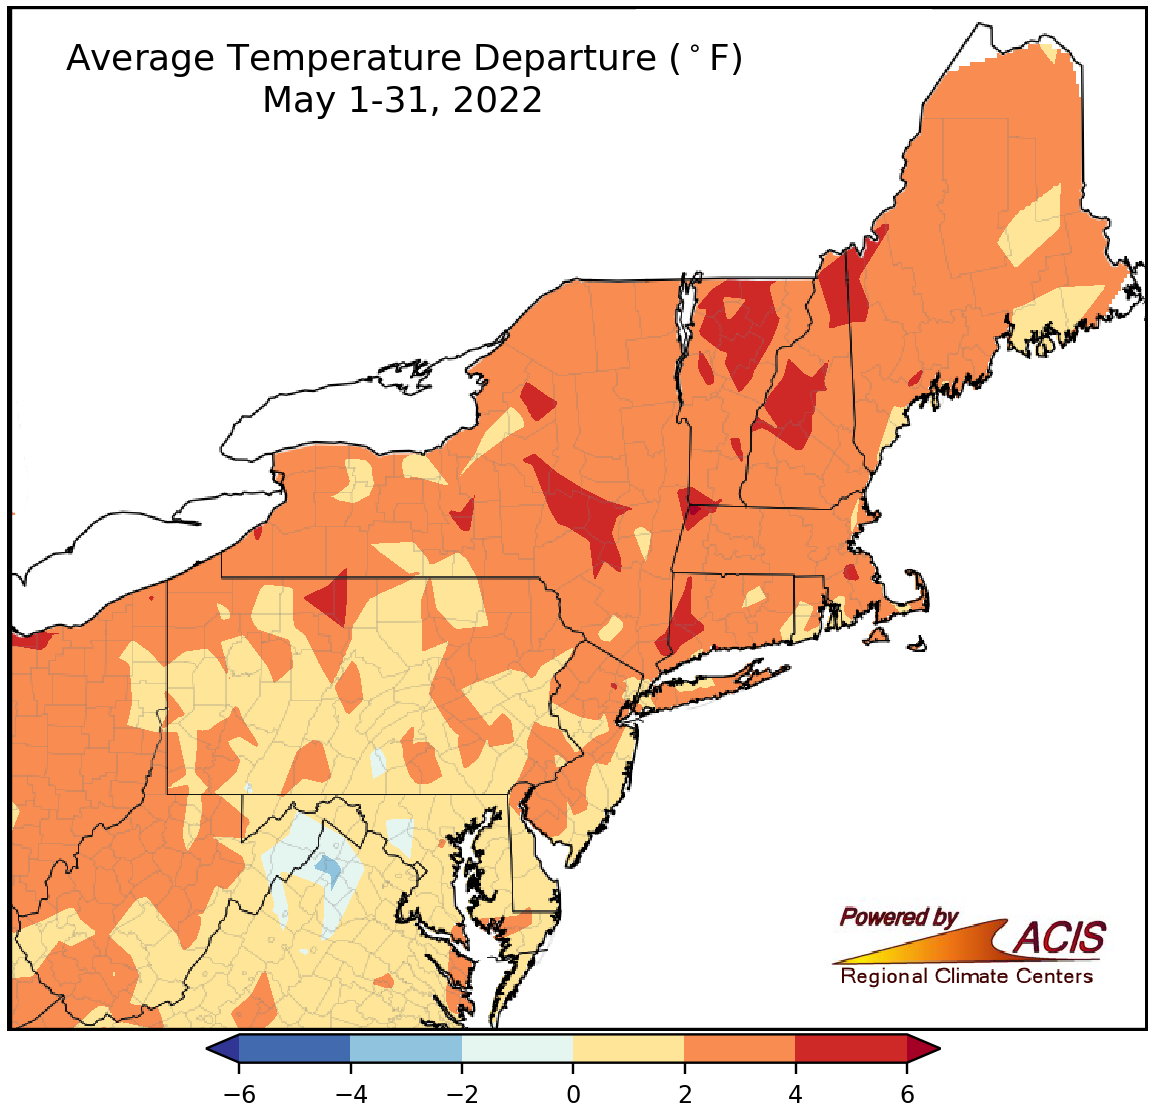
May average temperatures generally ranged from near normal to 6°F above normal.
Almost the entire Northeast experienced a warmer-than-normal May, with average temperatures ranging from near normal in parts of Maryland and West Virginia to 6°F above normal in parts of New York and New England. May average temperatures at the 35 major climate sites ranged from 0.5°F above normal at LaGuardia Airport, NY, to 3.9°F above normal in Hartford, CT, with 26 of the sites experiencing one of their 20 warmest Mays on record.
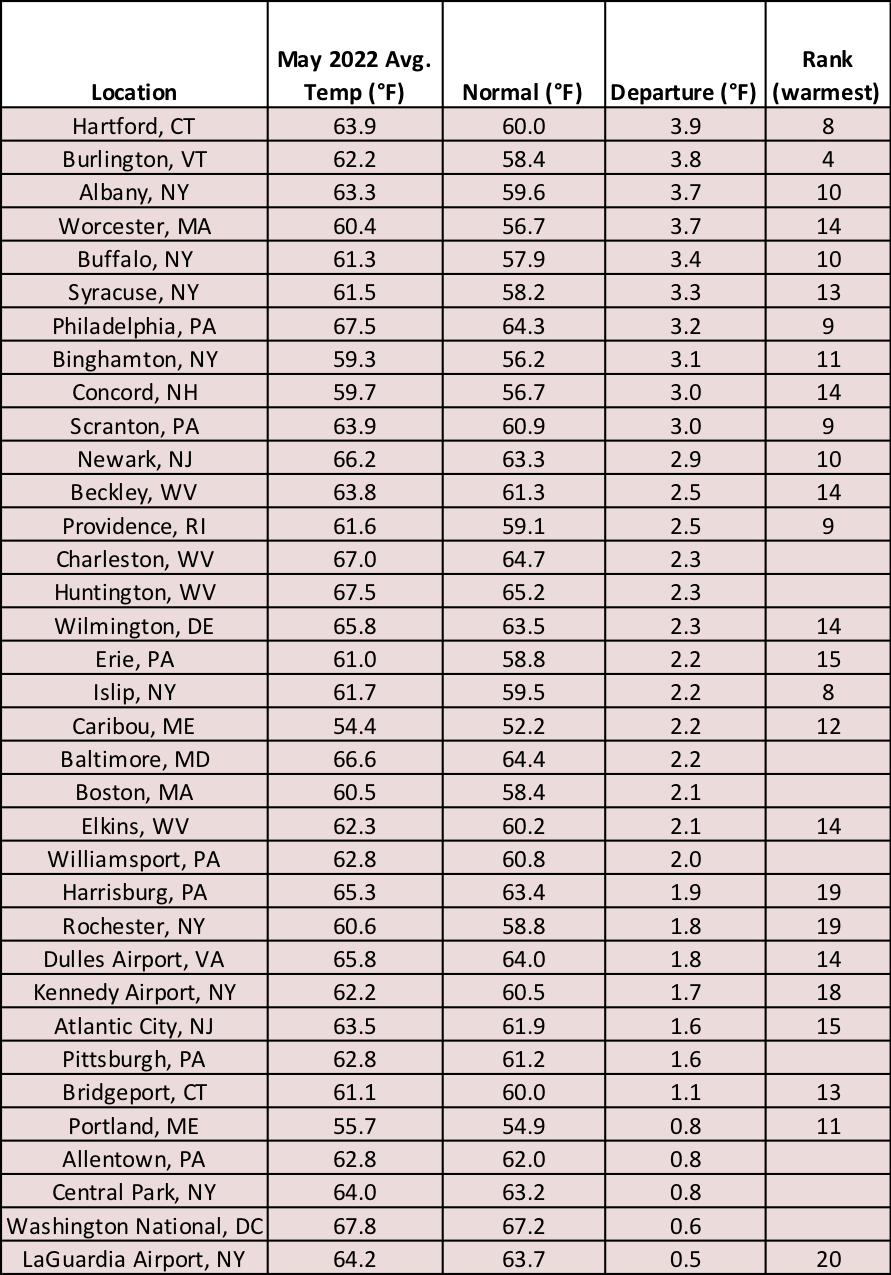
This May was among the 20 warmest on record for 26 major climate sites.
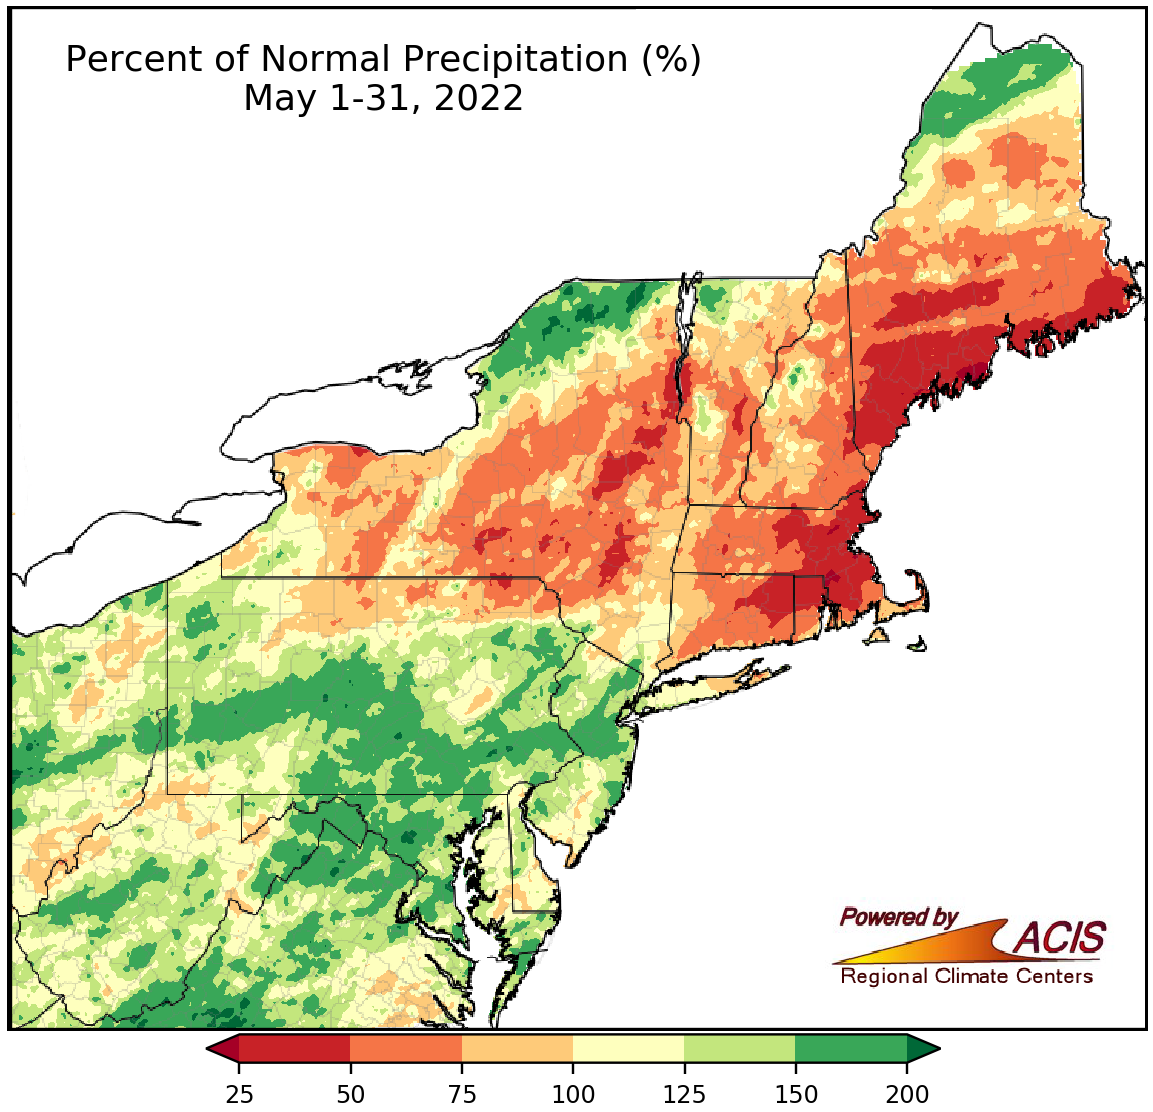
May precipitation ranged from 25% of normal to 200% of normal.
May precipitation ranged from 25% of normal to 200% of normal. The driest locations included parts of southern New England and coastal Maine, with moderate drought and abnormal dryness introduced in those areas. The wettest areas included parts of Pennsylvania, Maryland, and West Virginia, easing drought and dryness in those areas. May precipitation at the 35 major climate sites ranged from 31% of normal in Portland, ME, to 174% of normal in Harrisburg, PA, with 19 of the sites being wetter than normal. This May ranked among the 20 driest on record for three major climate sites but among the 20 wettest for six of the sites. There was little, if any, snowfall in the region during May.
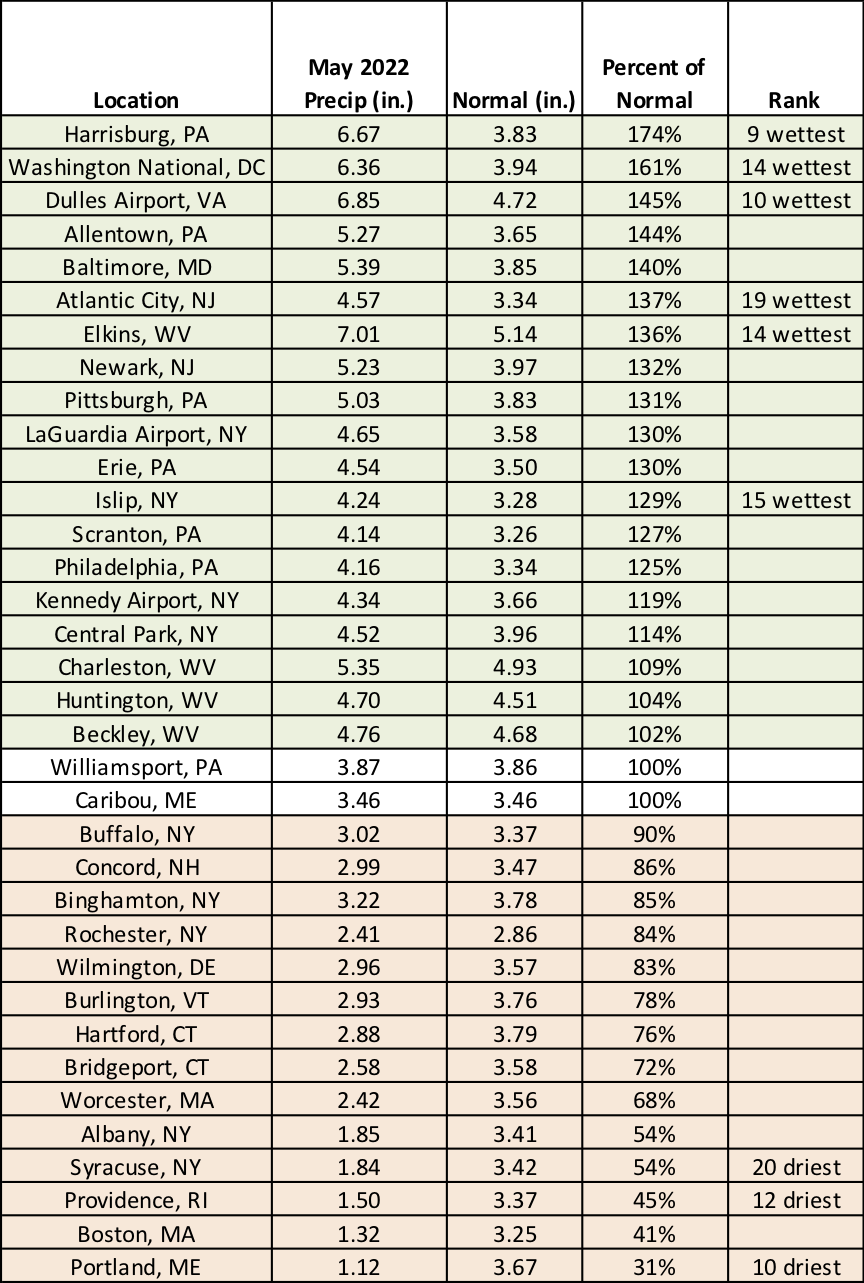
This May ranked among the 20 driest on record for three major climate sites but among the 20 wettest for six of the sites.
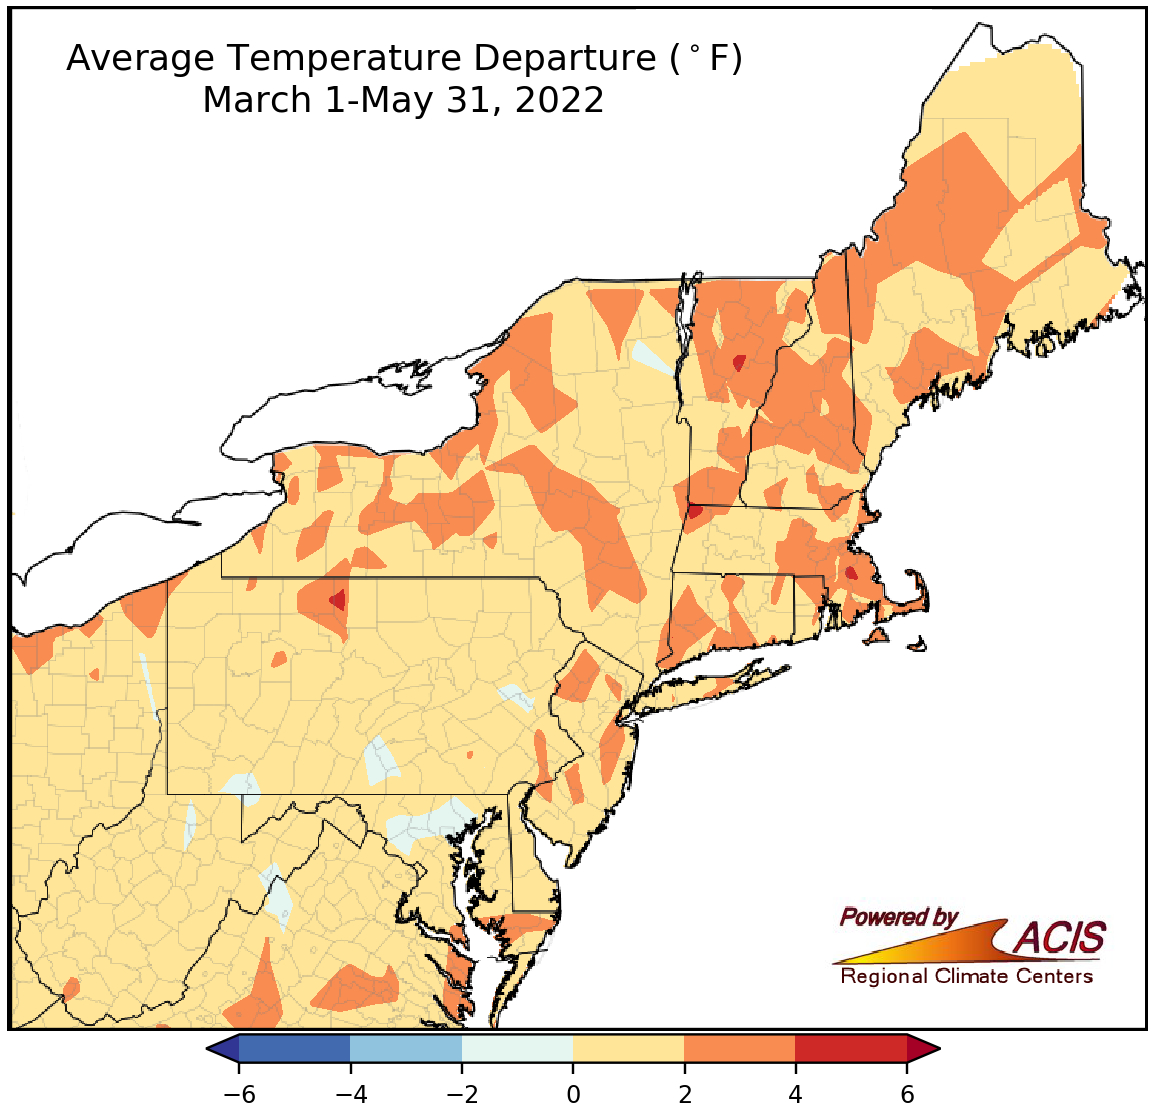
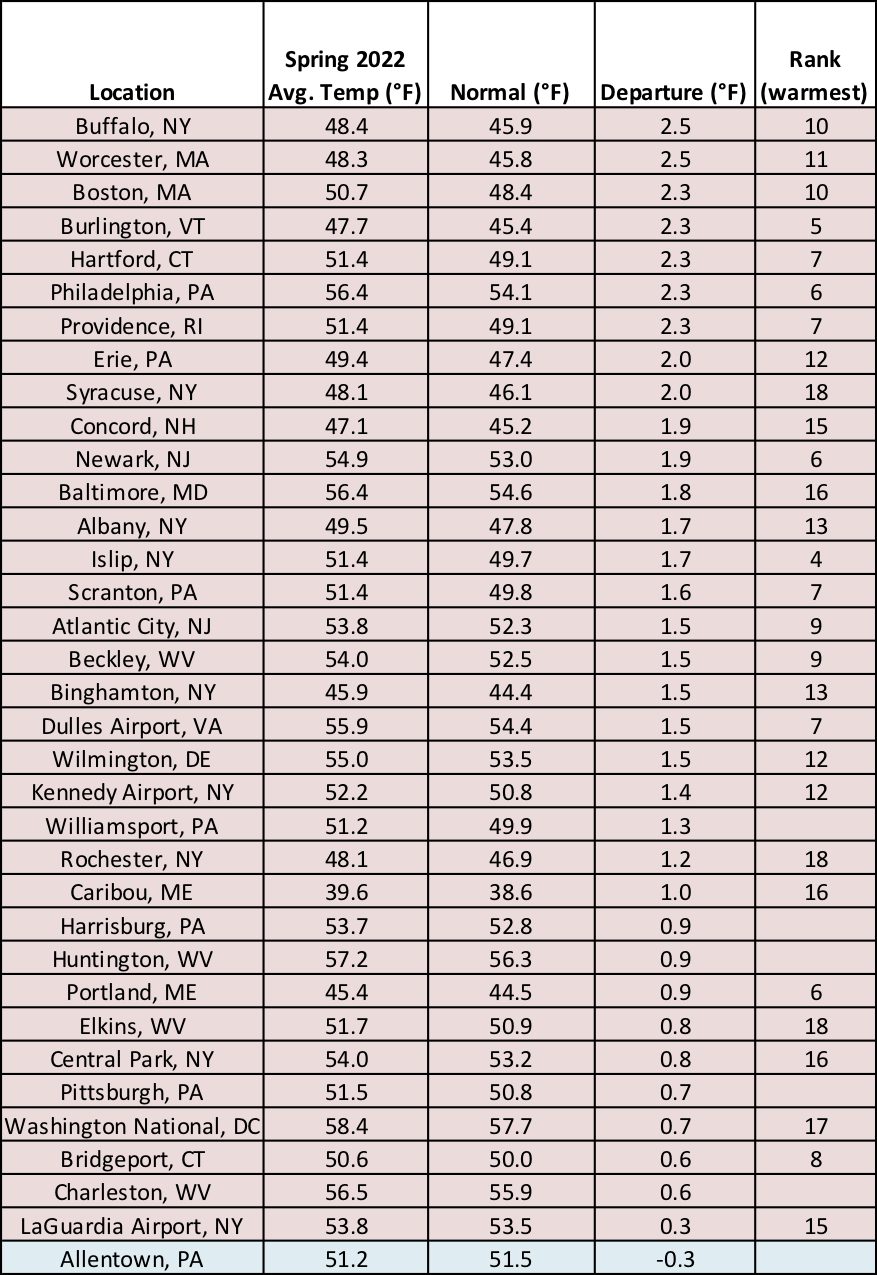
Spring temperatures ranged from near normal to 4°F above normal.
Spring average temperatures generally ranged from near normal to 4°F above normal. At the 35 major climate sites, spring average temperatures ranged from 0.3°F below normal at Allentown, PA, the lone cooler-than-normal site, to 2.5°F above normal in Buffalo, NY, and Worcester, MA. This spring ranked among the 20 warmest on record for 29 of the major climate sites.
This spring ranked among the 20 warmest on record at 29 major climate sites.
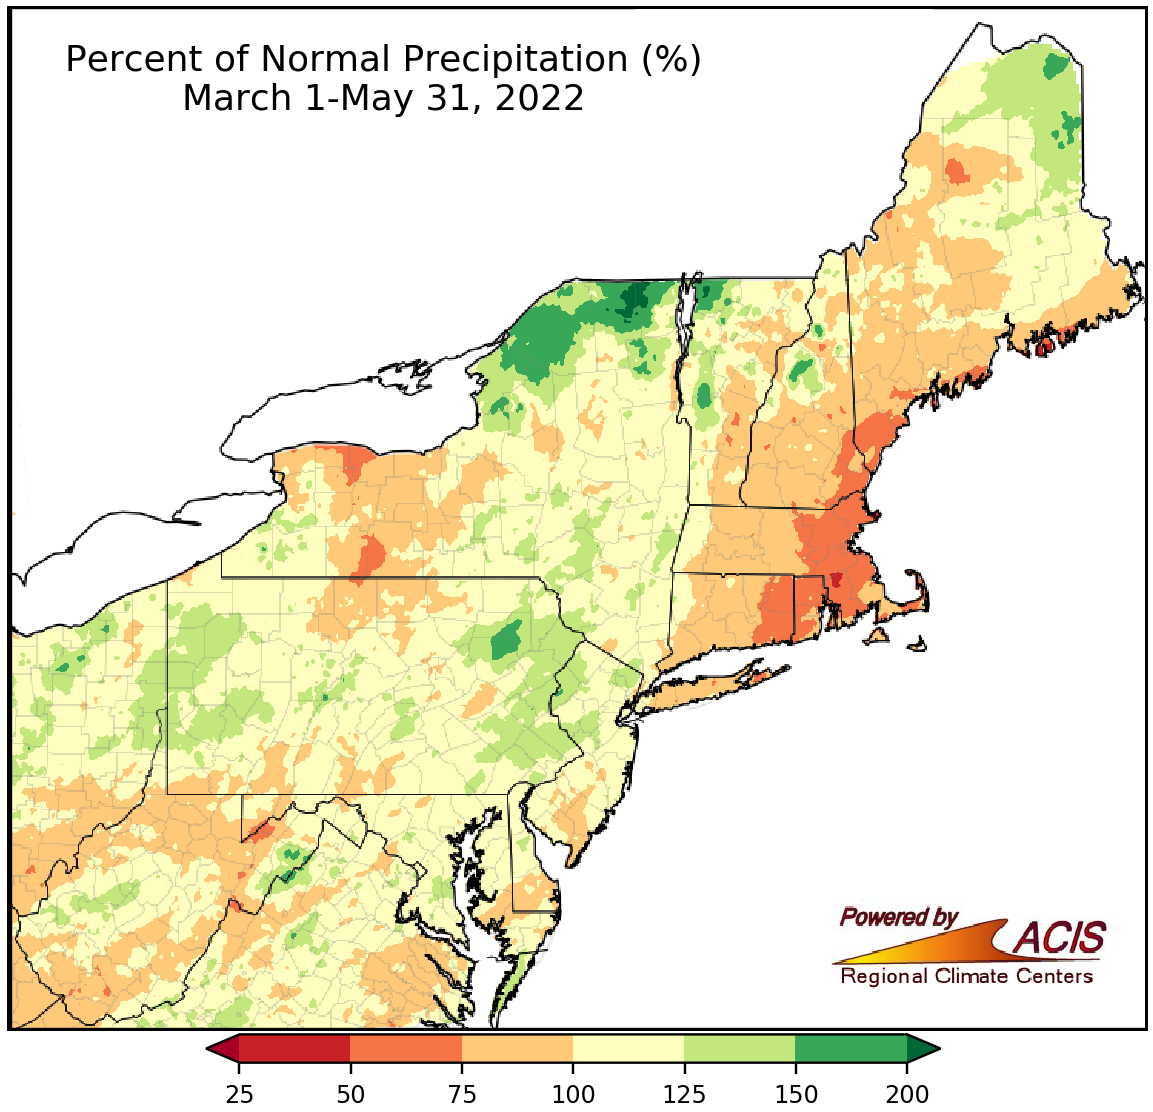
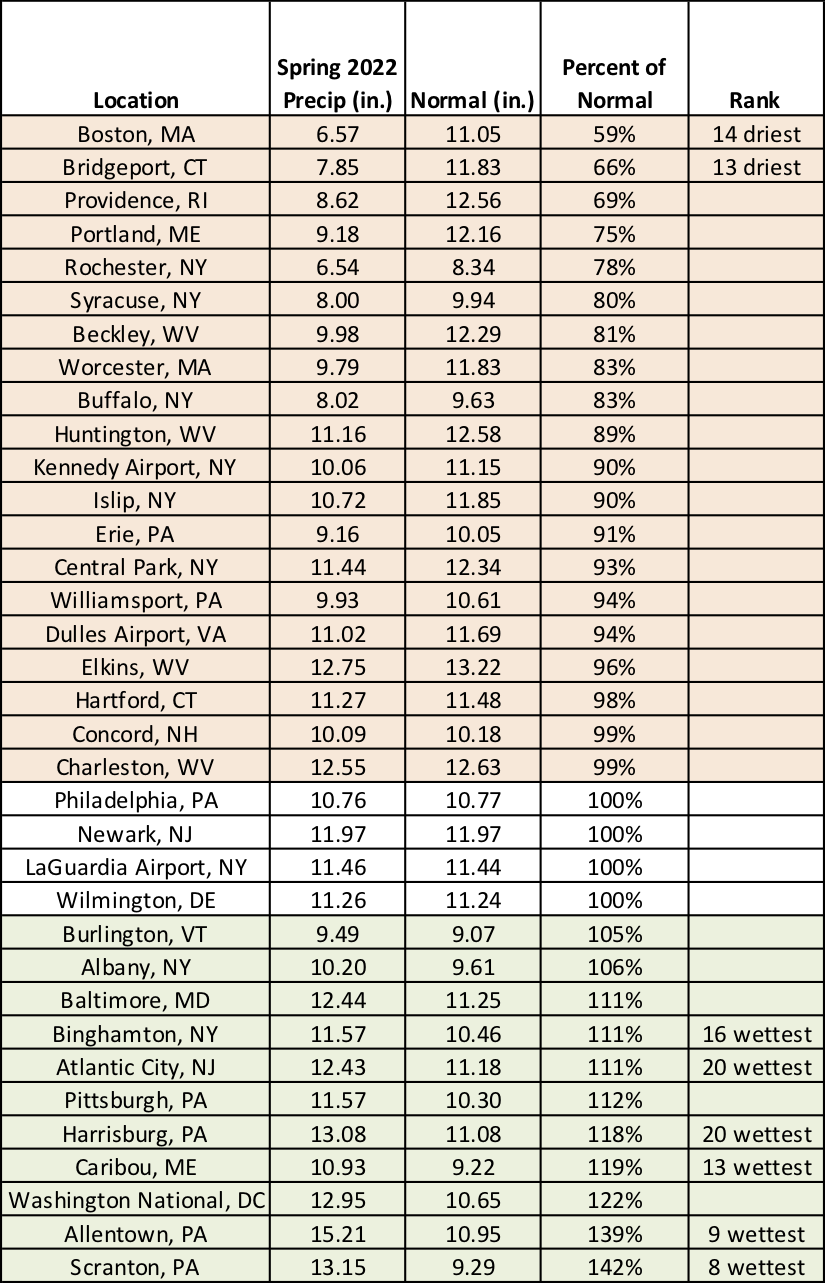
Spring precipitation ranged from 50% of normal to 200% of normal for most of the Northeast.
Spring precipitation generally ranged from 50% of normal in areas such as coastal New England and western New York to 200% of normal in areas such as northern New York, northwestern Vermont, and northeastern Pennsylvania. Spring precipitation at the 35 major climate sites ranged from 59% of normal in Boston, MA, to 142% of normal in Scranton, PA, with 20 major climate sites being drier than normal. This spring ranked among the 20 driest on record for two major climate sites but among the 20 wettest on record for six of the sites.
This spring ranked among the 20 driest on record for two major climate sites but among the 20 wettest on record for six of the sites.
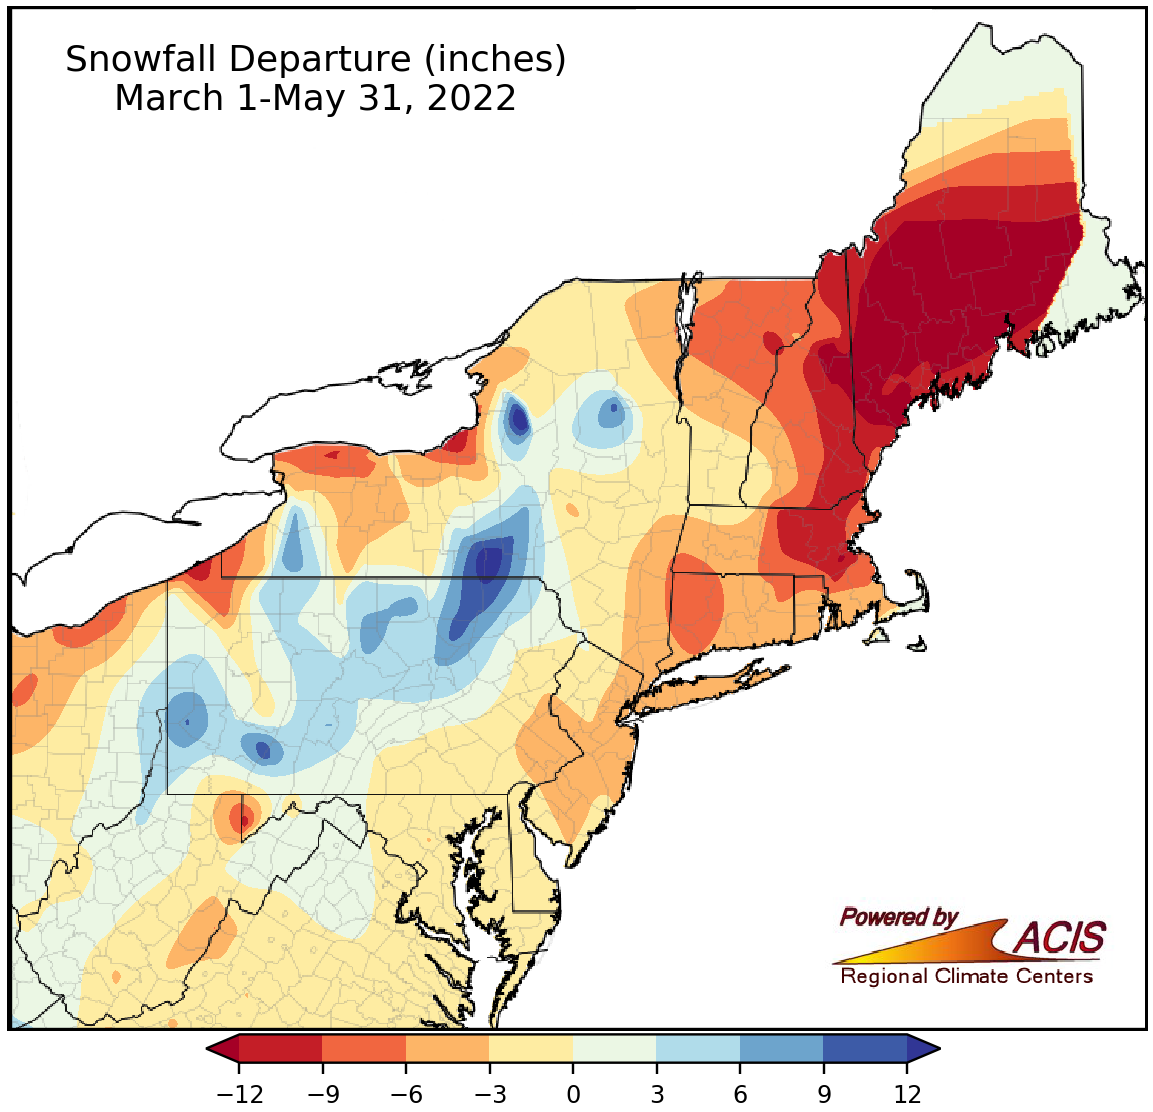
Spring snowfall ranged from more than 12 inches below normal to more than 12 inches above normal.
Spring snowfall ranged from more than 12 inches below normal in parts of Maine and New Hampshire to more than 12 inches above normal in south-central New York. Spring snowfall at the 35 major climate sites ranged from 13.4 inches below normal in Portland, ME, to 16.6 inches above normal in Binghamton, NY, with 30 of the sites seeing below-normal snowfall. This spring ranked among the 20 least snowy on record for four major climate sites but among the 20 snowiest for three of the sites.
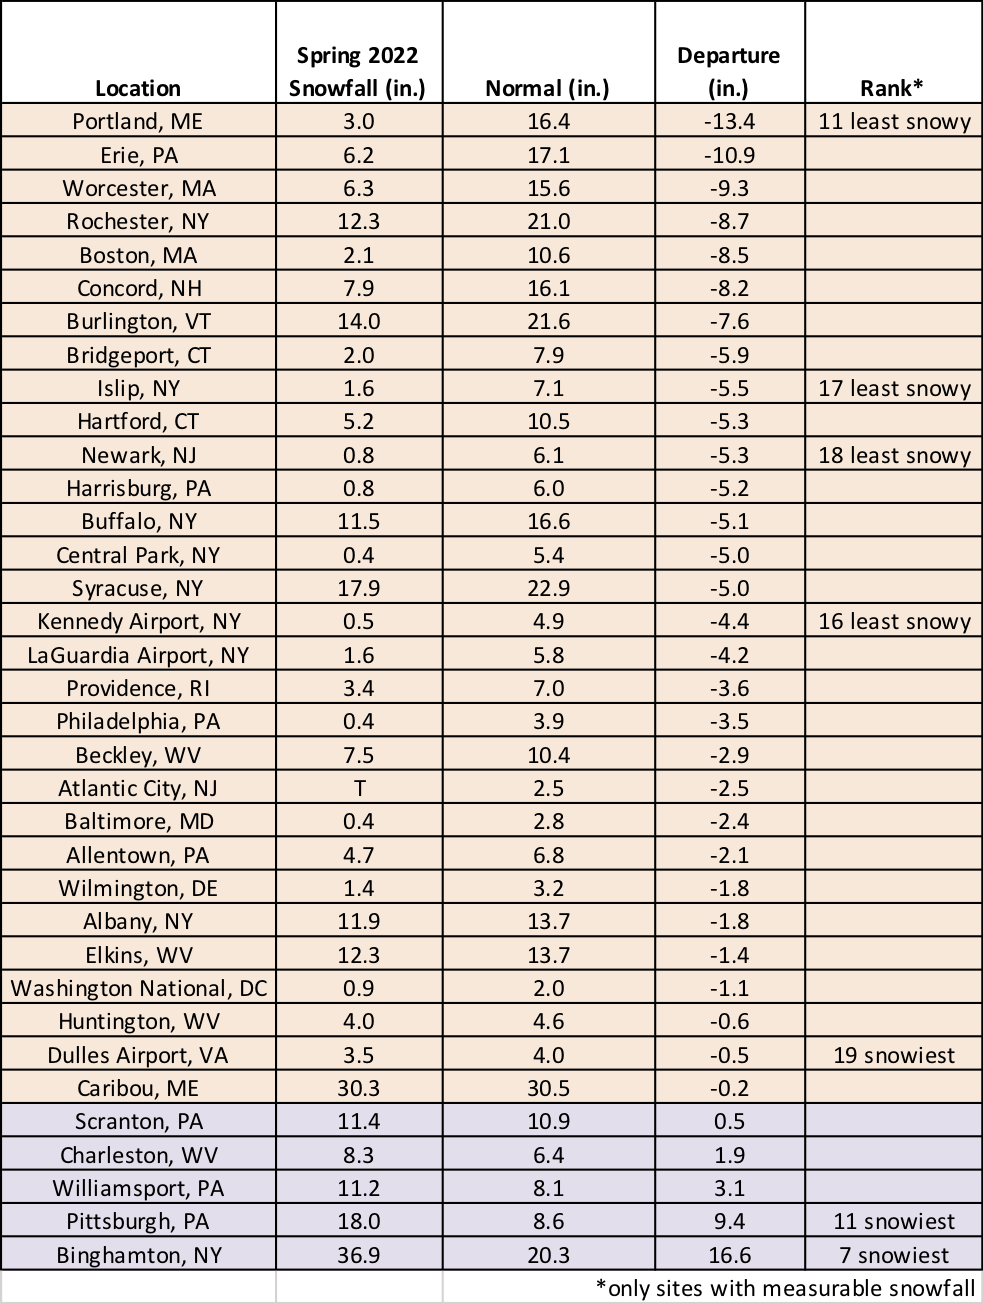
This spring ranked among the 20 least snowy on record for four major climate sites but among the 20 snowiest for three of the sites.
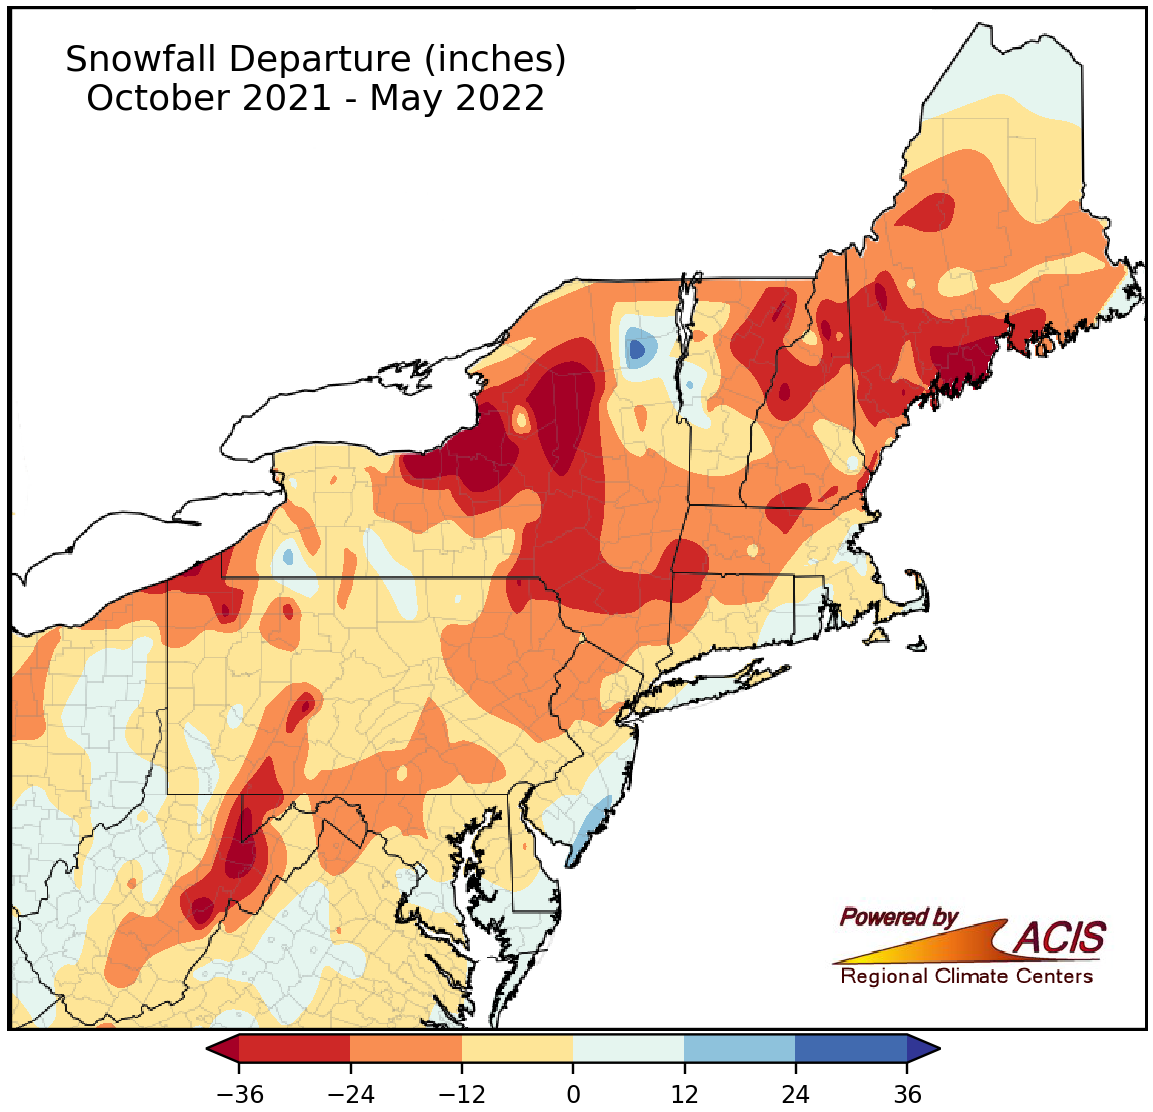
Seasonal (October-May) snowfall ranged from more than 36 inches below normal to 24 inches above normal.
For the snow season of October through May, snowfall ranged from more than 36 inches below normal in areas such as coastal Maine, northern/central New York, and eastern West Virginia to 24 inches above normal in spots such as southeastern New Jersey. Seasonal snowfall at the 35 major climate sites ranged from 51.8 inches below normal in Syracuse, NY, to 15.9 inches above normal in Atlantic City, NJ, with 27 of the sites seeing below-normal snowfall. This snow season ranked among the 20 least snowy on record for seven major climate sites but among the 20 snowiest for two of the sites.
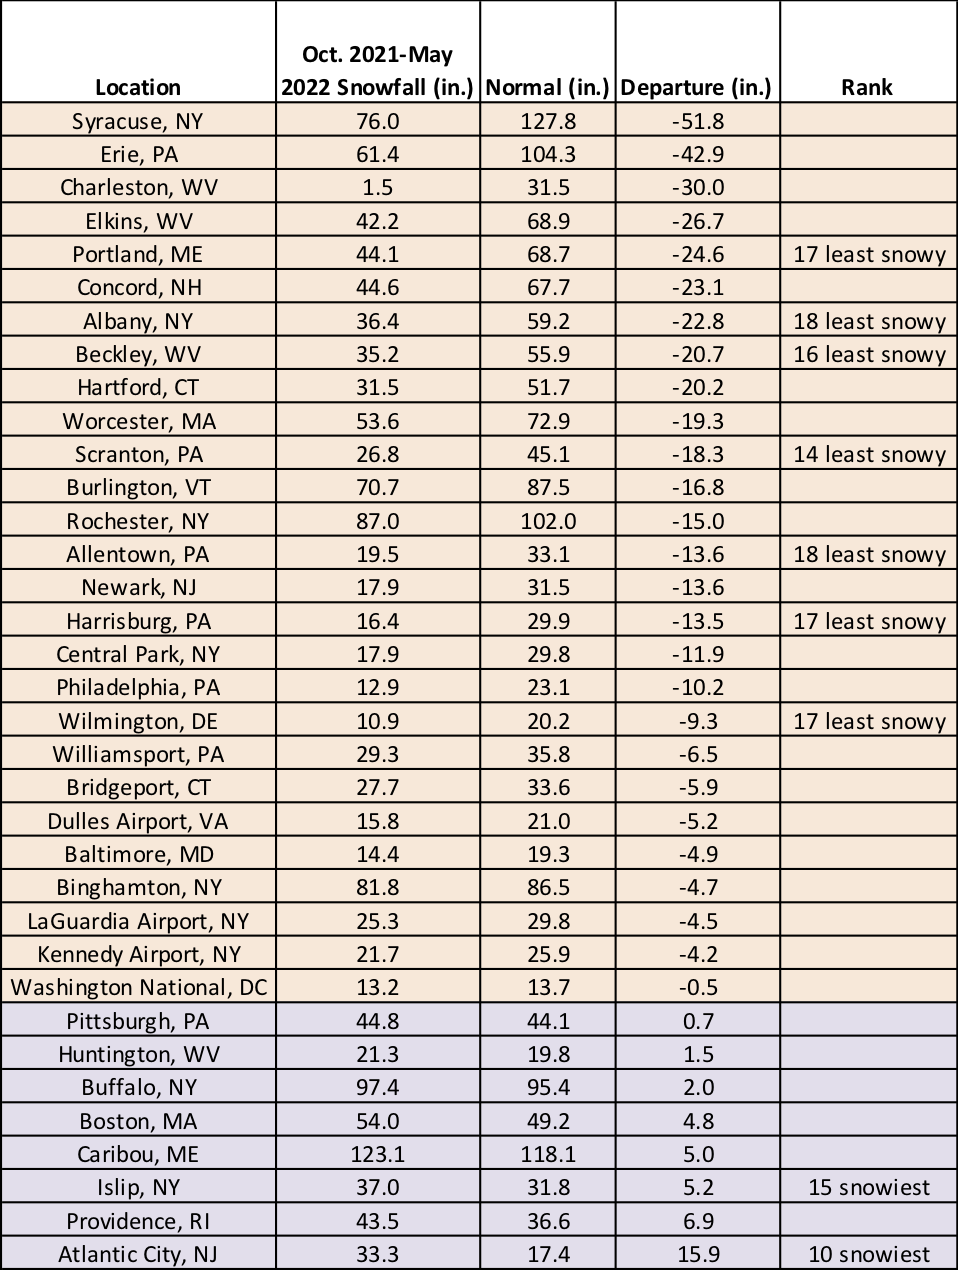
This snow season (October-May) ranked among the 20 least snowy on record for seven major climate sites but among the 20 snowiest for two of the sites.
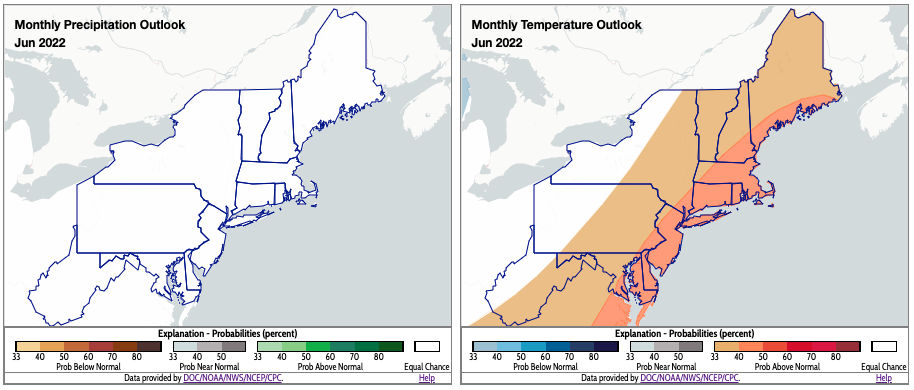
June is expected to be warmer than normal for much of the Northeast (map right). Click to enlarge.
For June, NOAA’s Climate Prediction Center (CPC) favors above-normal temperatures for the Northeast except far interior locations from western West Virginia to northern New York where equal chances of below-, near-, or above-normal temperatures were forecast. The entire Northeast falls into the equal chances category for precipitation, indicating no clear climate signal. For summer, there’s a tilt toward above-normal temperatures for the entire Northeast. Some southern and eastern parts of the region could be wetter than normal, with equal chances of below-, near-, or above-normal precipitation forecast for the rest of the region.
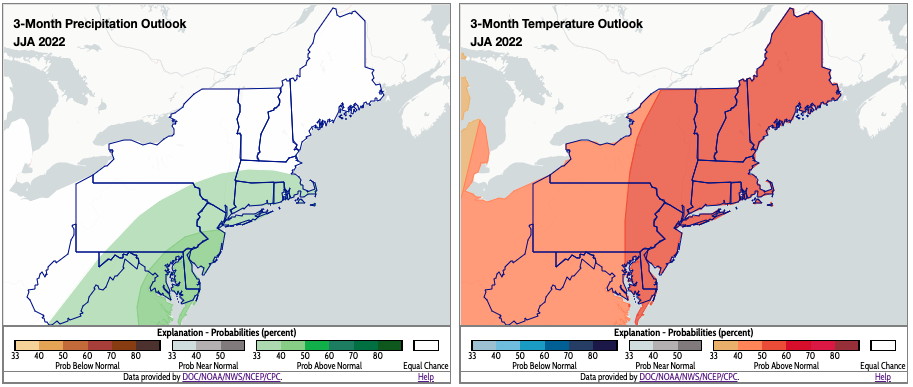
CPC’s summer outlooks indicate a tilt toward wetter-than-normal conditions for some locations (shaded green in map on the left) and warmer-than-normal conditions for all areas (map right). Click to enlarge.