A Warm November Closes Out Fall
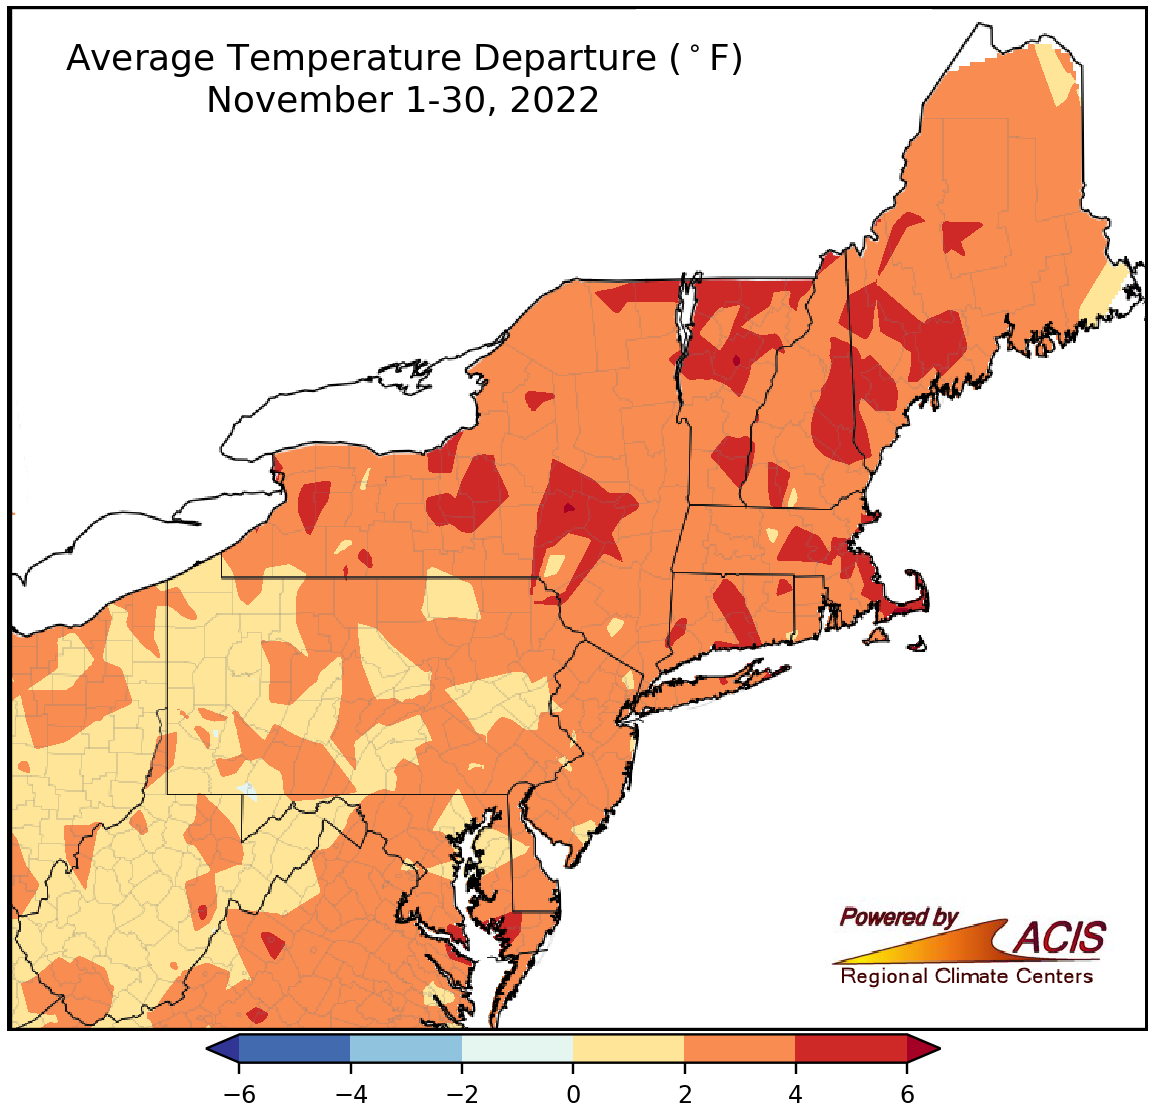
November average temperatures ranged from near normal to 6°F above normal.
The Northeast experienced a warmer-than-normal November, driven primarily be record or near-record warmth during early November. November average temperatures ranged from near normal in much of West Virginia and parts of Pennsylvania and Maryland to 6°F above normal in parts of New York and New England. All 35 major climate sites experienced above-normal temperatures in November, ranging from 0.7°F above normal in Erie, PA, to 5.3°F above normal in Worcester, MA. This November ranked among the 20 warmest on record for 24 major climate sites.
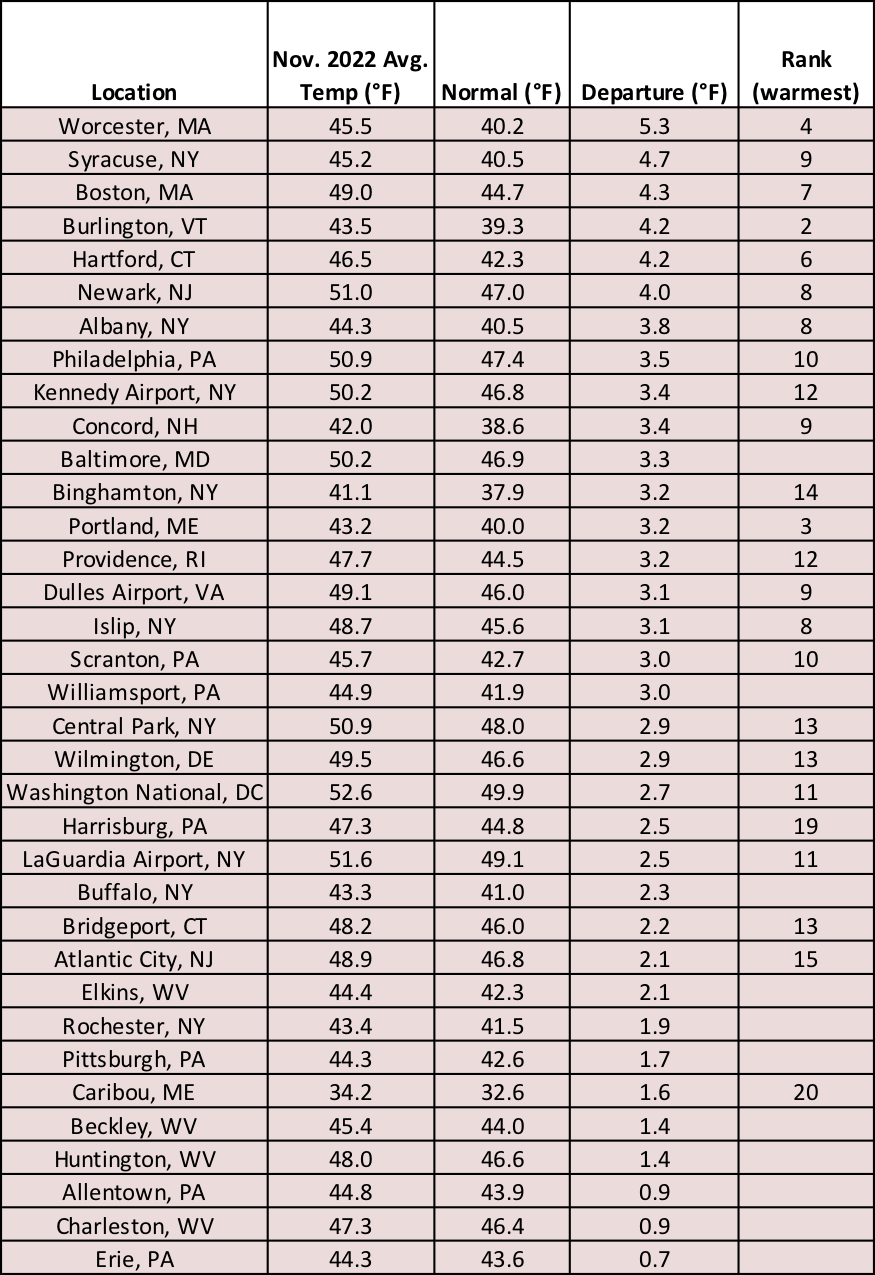
November 2022 was among the 20 warmest Novembers on record for 24 major climate sites.
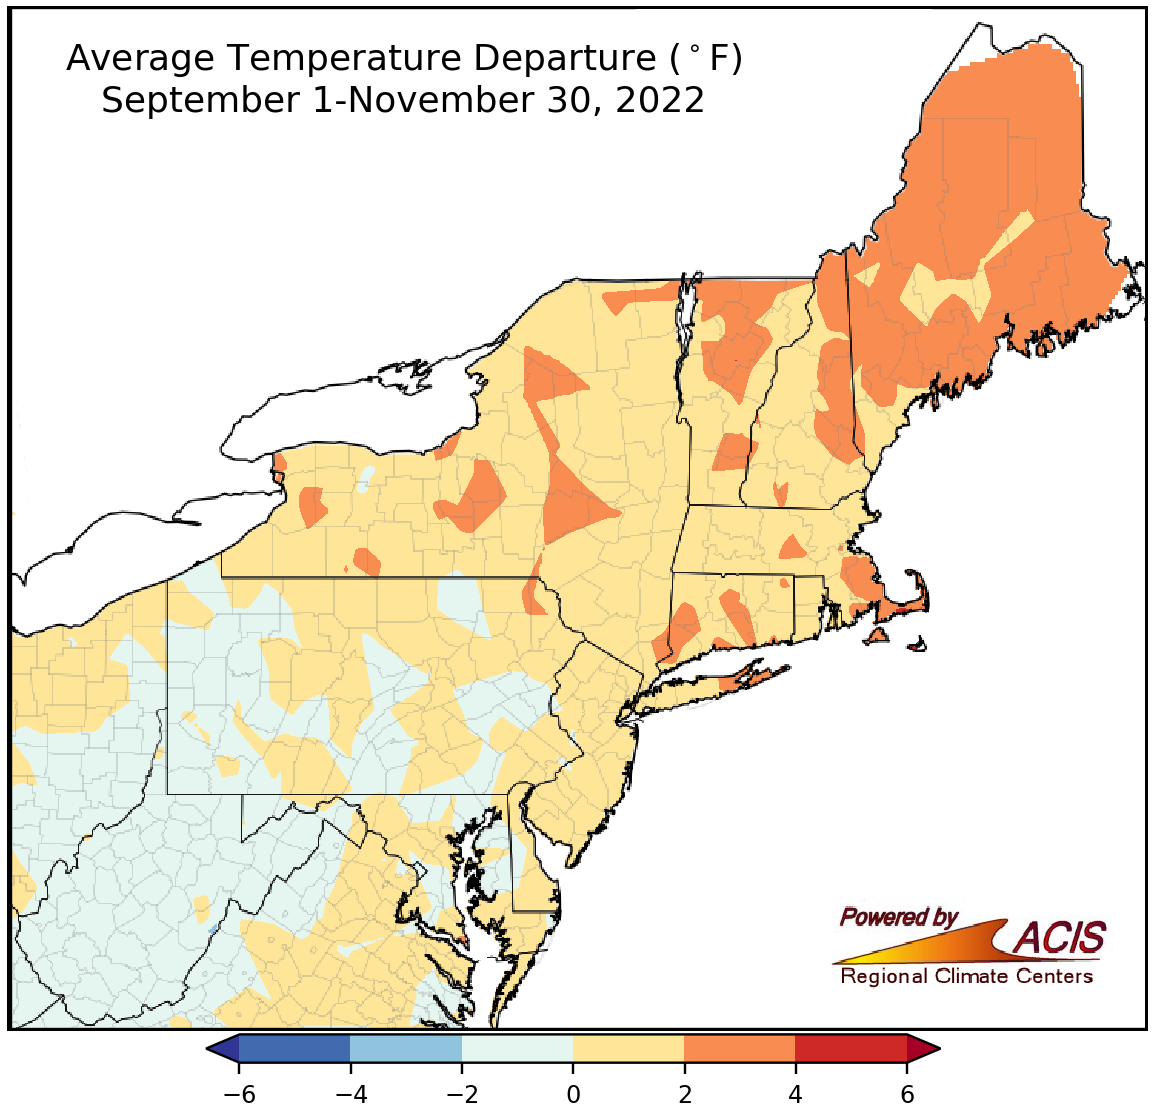
Fall average temperatures ranged from 2°F below normal to 4°F above normal.
While November was warmer than normal, September and October featured a range of temperatures. The influence of those two months can be seen in fall average temperatures, which ranged from 2°F below normal in West Virginia, Maryland, and Pennsylvania to 4°F above normal in parts of New York and New England. At the 35 major climate sites, fall average temperatures ranged from 1.5°F below normal in Charleston, WV, its 20th coolest fall, to 2.4°F above normal in Syracuse, NY, and Worcester, MA, their ninth warmest fall. Overall, 26 major climates sites were warmer than normal with 16 having one of their 20 warmest falls on record.
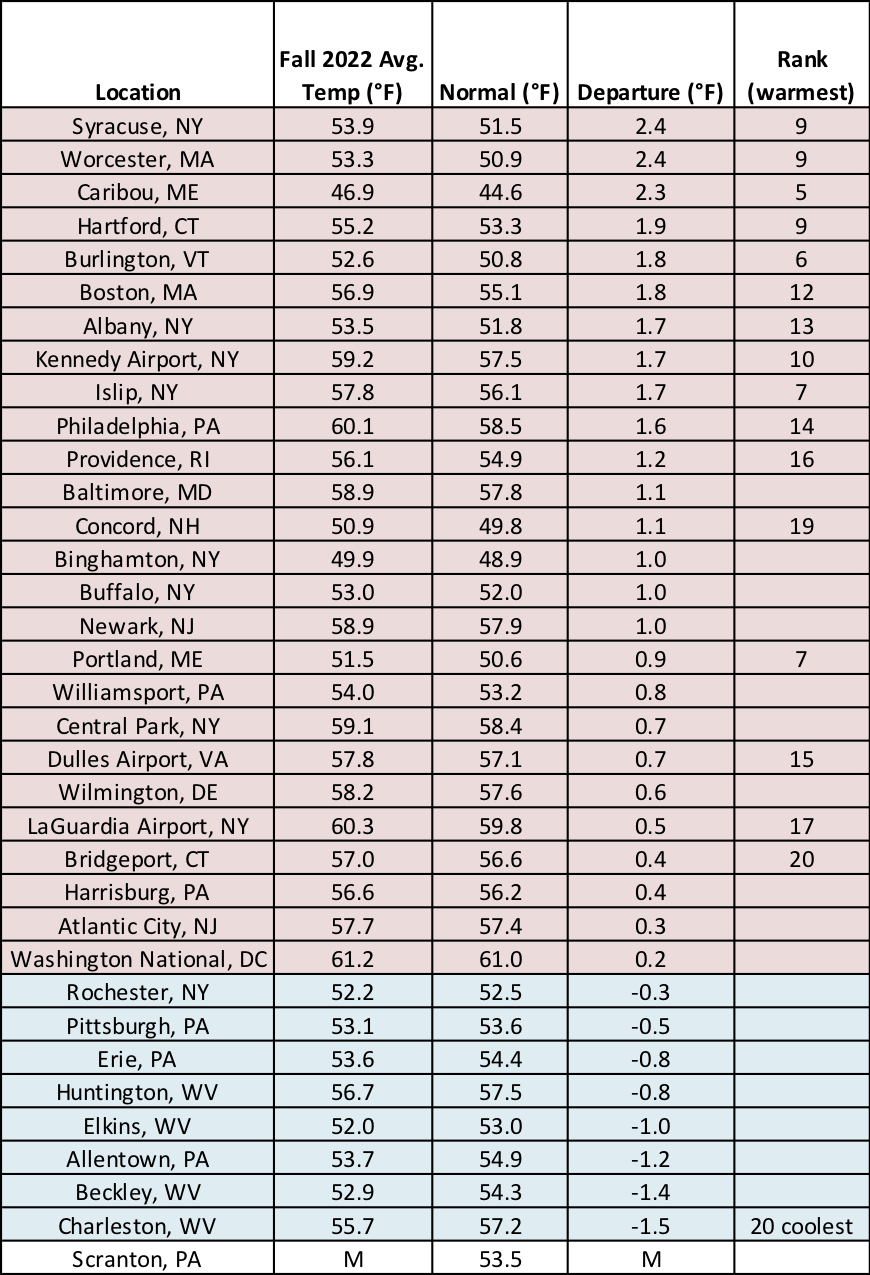
This fall ranked among the 20 warmest on record for 16 major climate stes but was Charleston, WV’s 20th coolest.
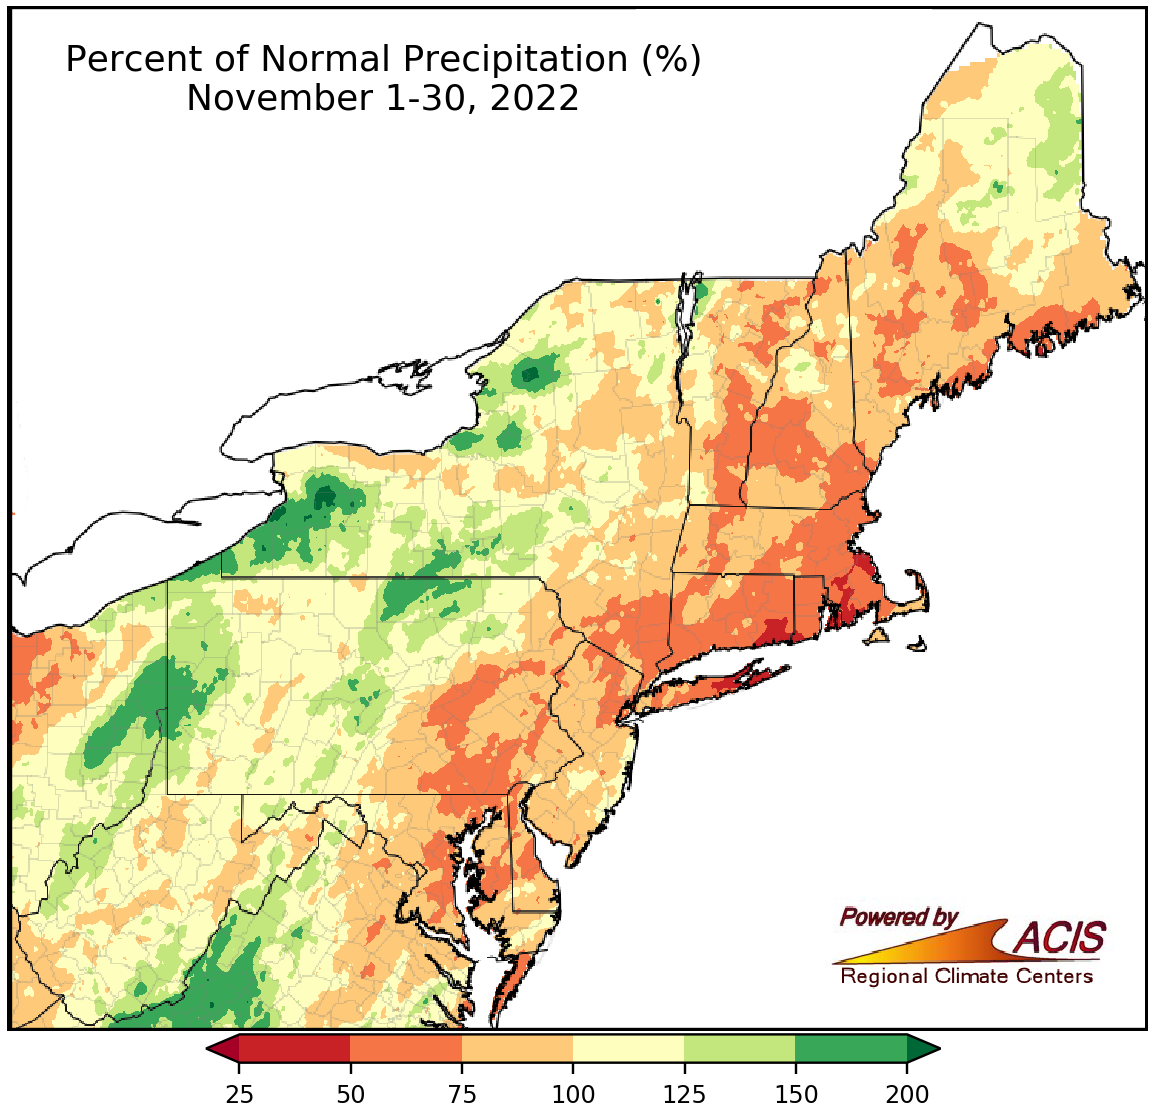
November precipitation ranged from 25% of normal to more than 200% of normal.
During November, coastal areas tended to be drier than normal while interior parts of the region tended to be wetter than normal. The driest locations included southern New England and New York’s Long Island, which saw less than 50% of normal precipitation. The drier-than-normal conditions stalled recovery of drought and abnormal dryness in these areas. The wettest locations, which saw more than 150% of normal precipitation, included portions of upstate New York and northern and western Pennsylvania. These areas saw rainfall from the remnants of Hurricane Nicole, and in some spots, significant lake-effect snowfall. November precipitation at the 35 major climate sites ranged from 73% of normal in Boston, MA, and Islip, NY, its 20th driest November, to 197% of normal in Erie, PA, its fifth wettest November. Sixteen major climate sites were wetter than normal, with six ranking this November among their 20 wettest on record.
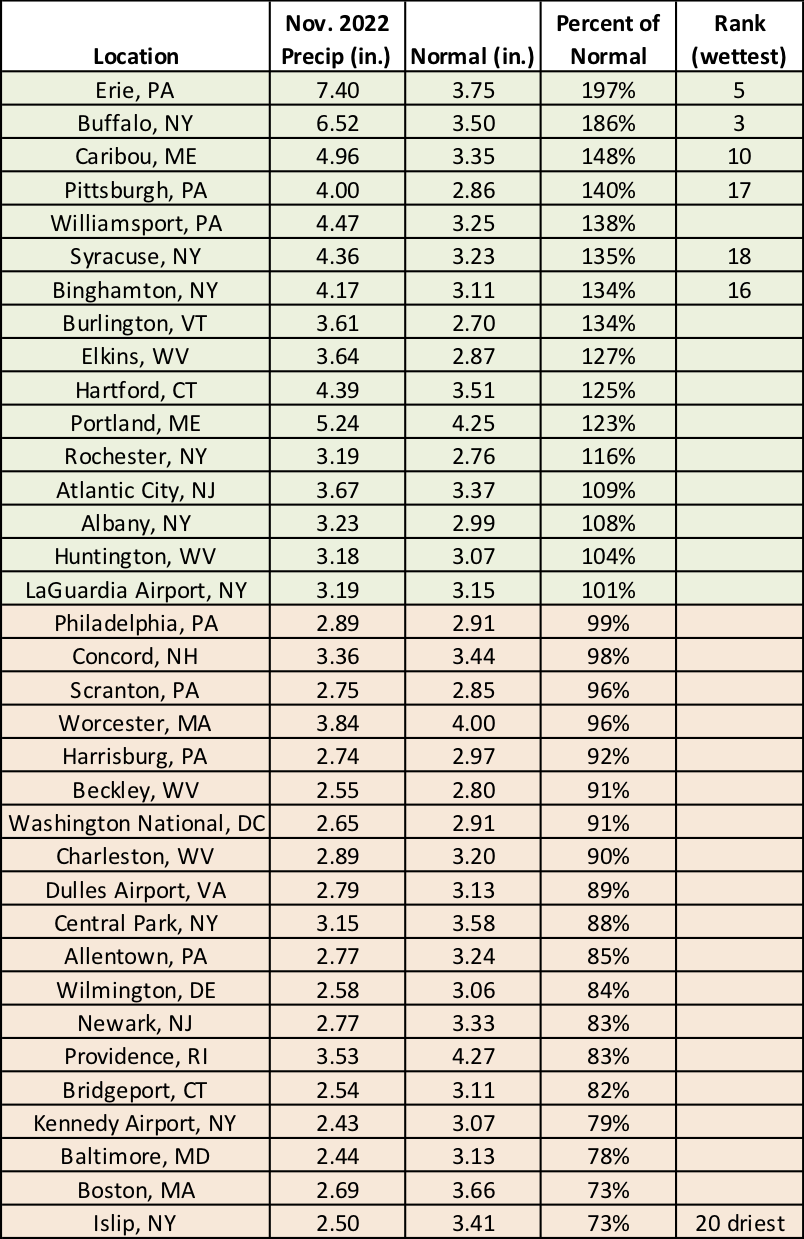
This November ranked among the 20 wettest on record for six major climate sites but was Islip, NY’s 20th driest.
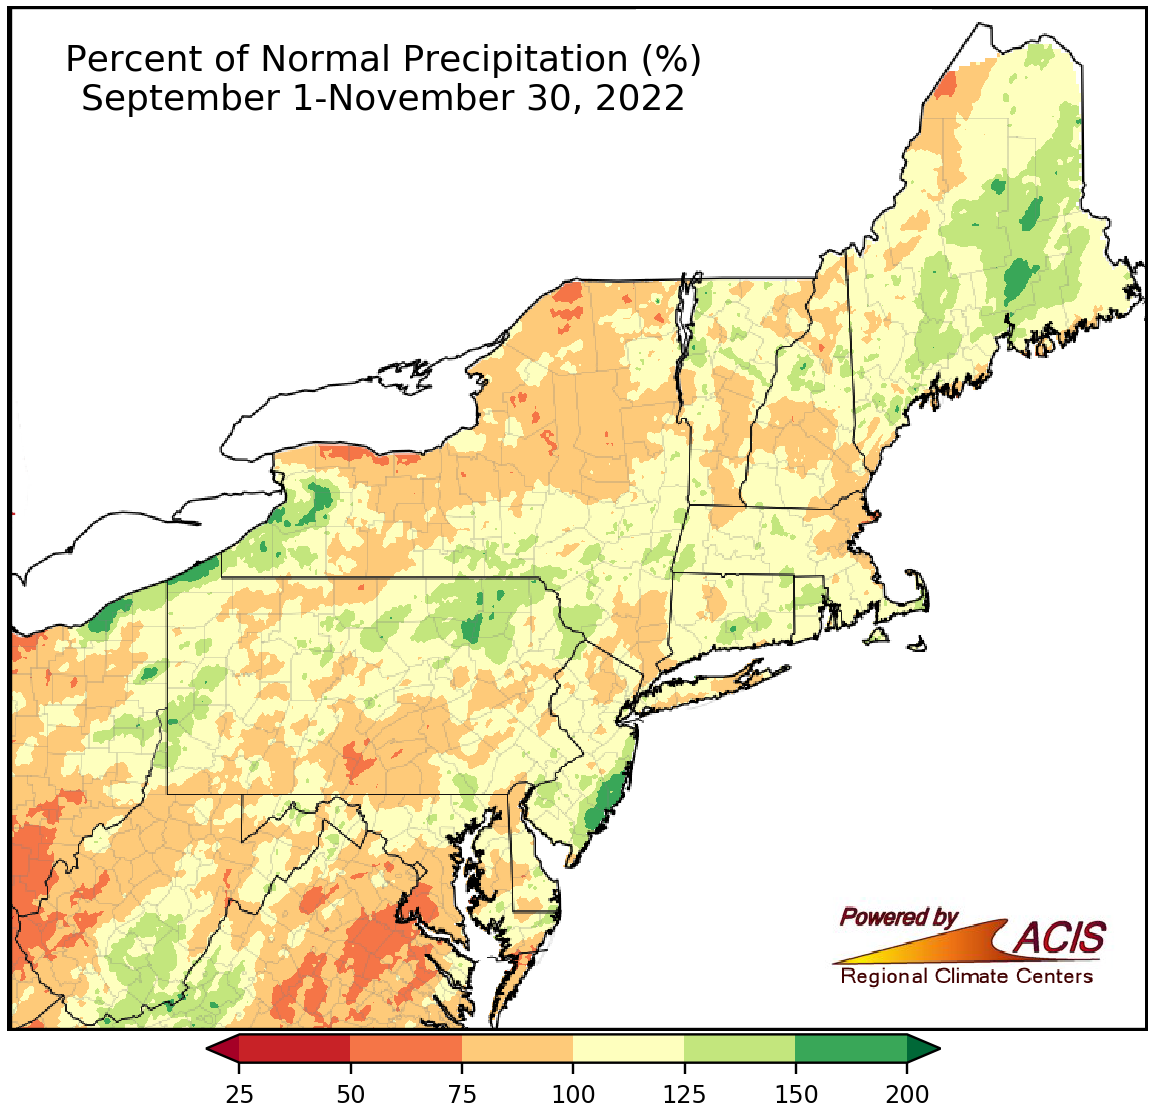
Fall precipitation ranged from 50% of normal to 200% of normal.
September, October, and November each featured precipitation extremes, so the fall season wrapped up with a range of conditions, as well. Fall precipitation ranged from 50% of normal in spots such as southwestern West Virginia and southern Maryland to 200% of normal in areas such as northwestern Pennsylvania and coastal New Jersey. At the 35 major climate sites, fall precipitation ranged from 63% of normal in Huntington, WV, to 165% of normal in Erie, PA, its second wettest fall. Of the 17 sites that were wetter than normal, nine experienced one of their 20 wettest falls on record.
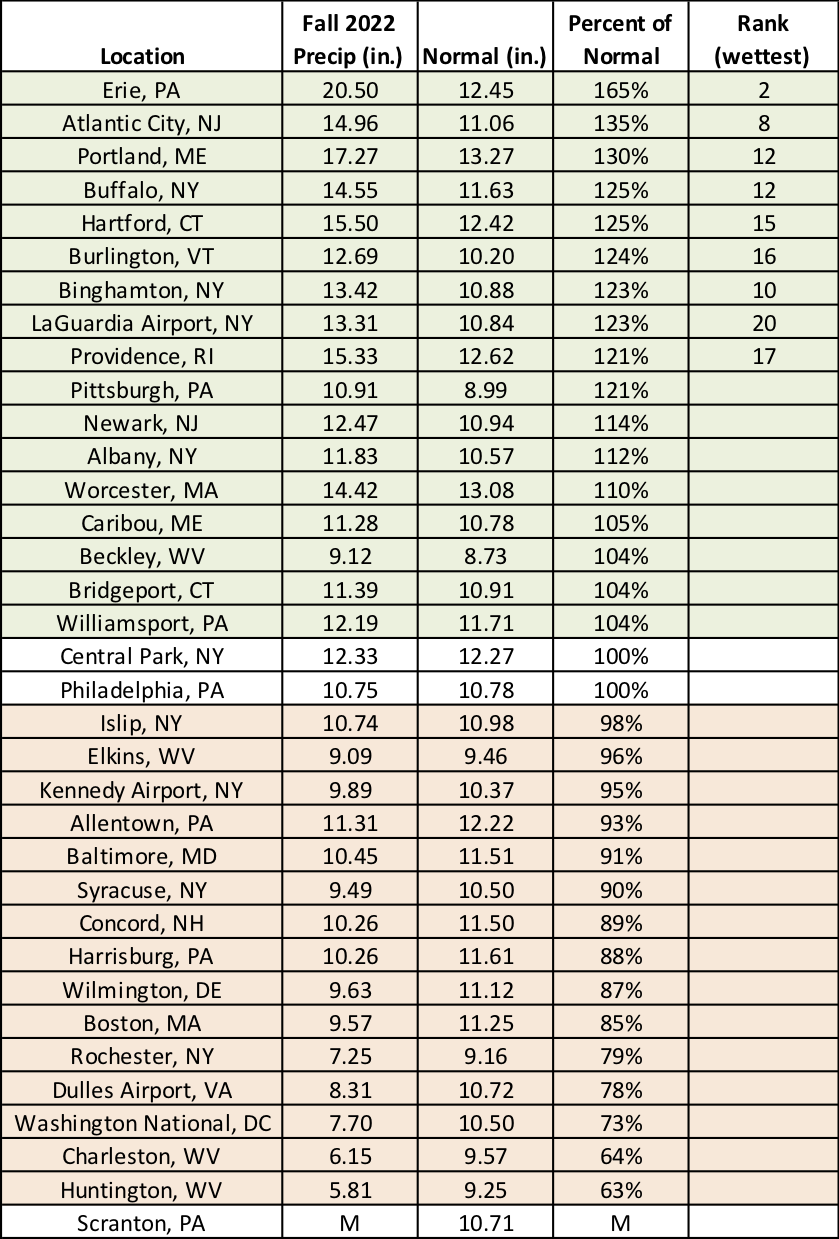
This fall ranked among the 20 wettest on record for nine major climate sites.
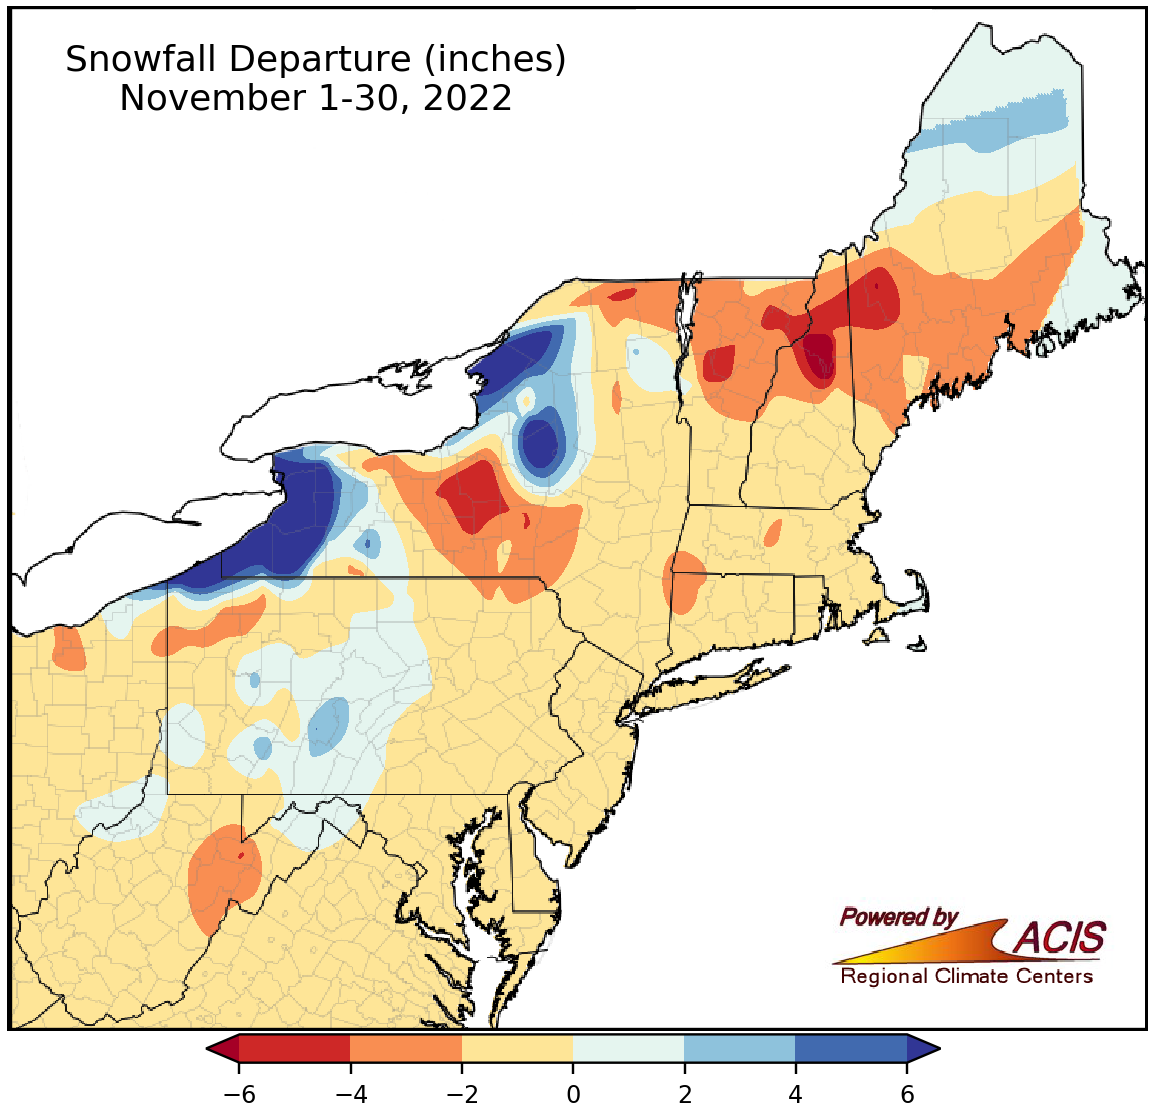
November snowfall ranged from more than 6 inches below normal to more than 6 inches above normal.
While November snowfall was near normal for much of the Northeast, there were some extremes. On the below-normal side, higher elevations of New Hampshire, as well as parts of central New York, had snowfall deficits exceeding 6 inches. On the above-normal side, northwestern Pennsylvania and western and northern New York saw a snowfall surplus of over 6 inches driven by the major lake-effect event from November 16-21. November snowfall at the 35 major climate sites ranged from 6.1 inches below normal in Syracuse, NY, to 29.1 inches above normal in Buffalo, NY, its second snowiest November. Also, Erie, PA, had its 10th snowiest November on record with a surplus of 13.3 inches.
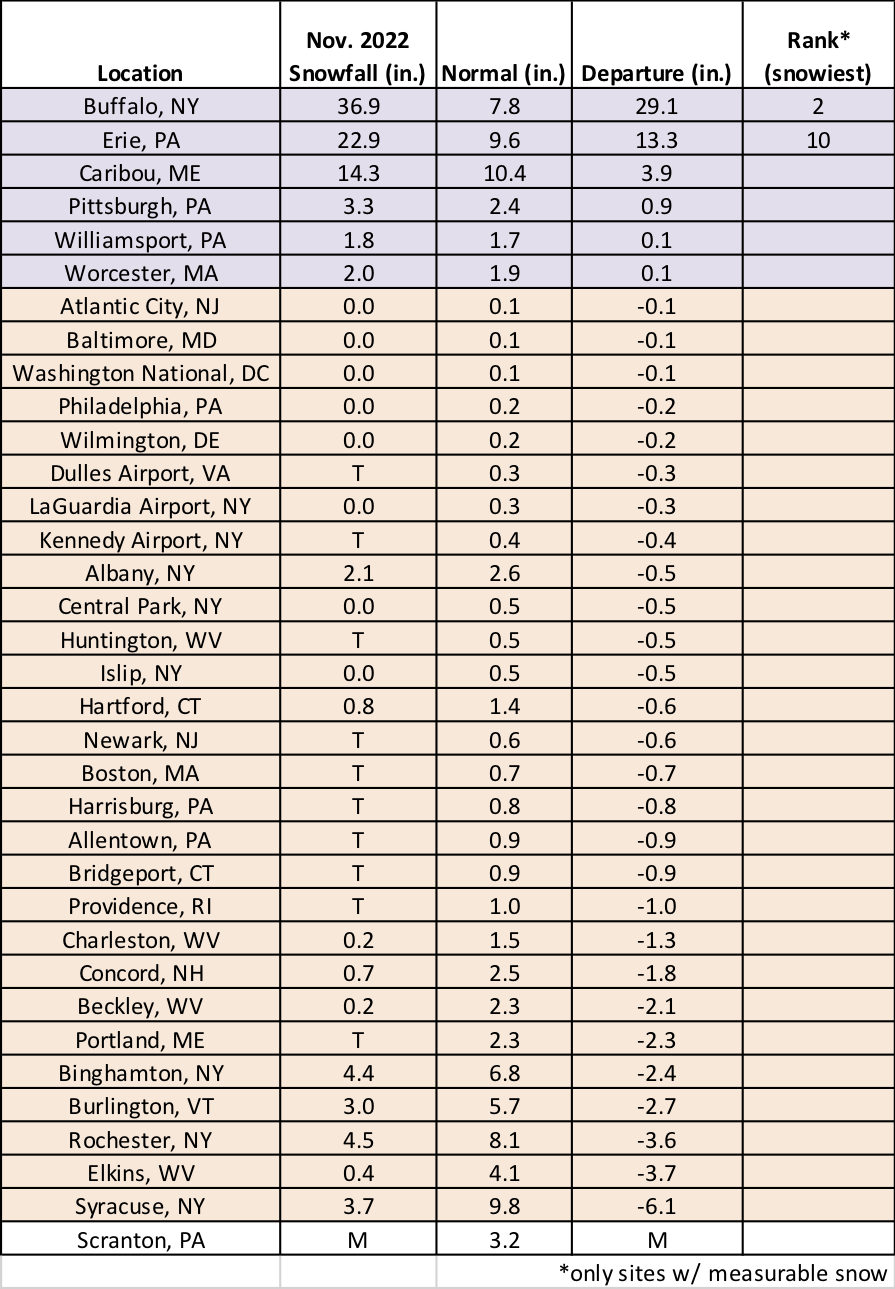
This November was the second snowiest on record for Buffalo, NY, and the 10th snowiest for Erie, PA.
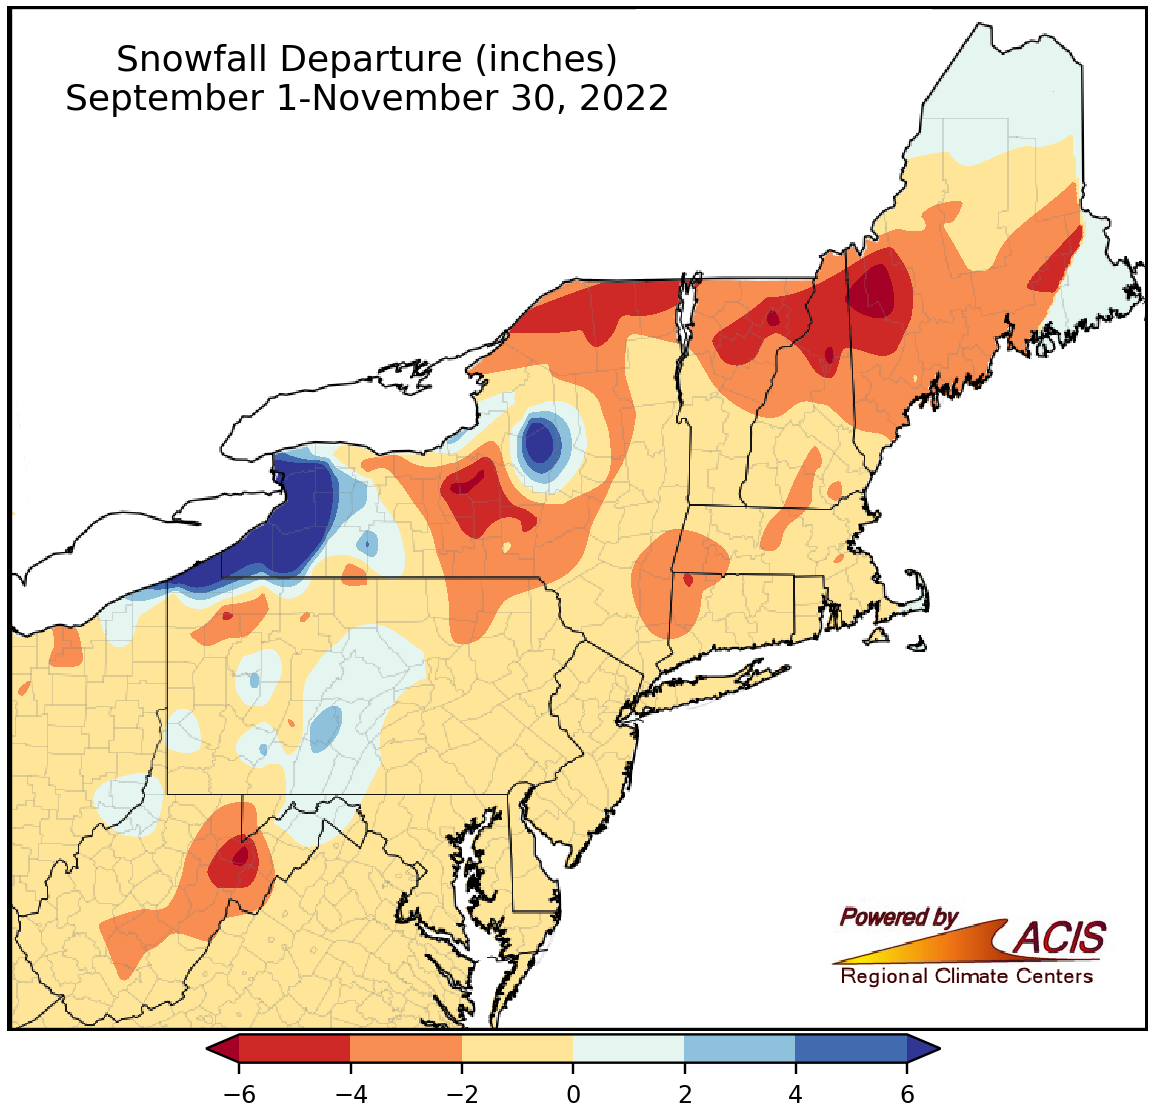
Fall snowfall ranged from more than 6 inches below normal to more than 6 inches above normal.
A similar pattern emerges for fall snowfall, with deficits of more than 6 inches in higher elevations of northern New England, localized parts of eastern West Virginia, portions of central New York and surpluses of over 6 inches where the large lake-effect snow event happened in northwestern Pennsylvania and western and northern New York. Fall snowfall at the 35 major climate sites ranged from 6.3 inches below normal in Syracuse, NY, to 28.2 inches above normal in Buffalo, NY. This fall ranked among the 20 least snowy on record for Beckley and Elkins, WV, but among the 20 snowiest for Buffalo, NY, and Erie, PA.
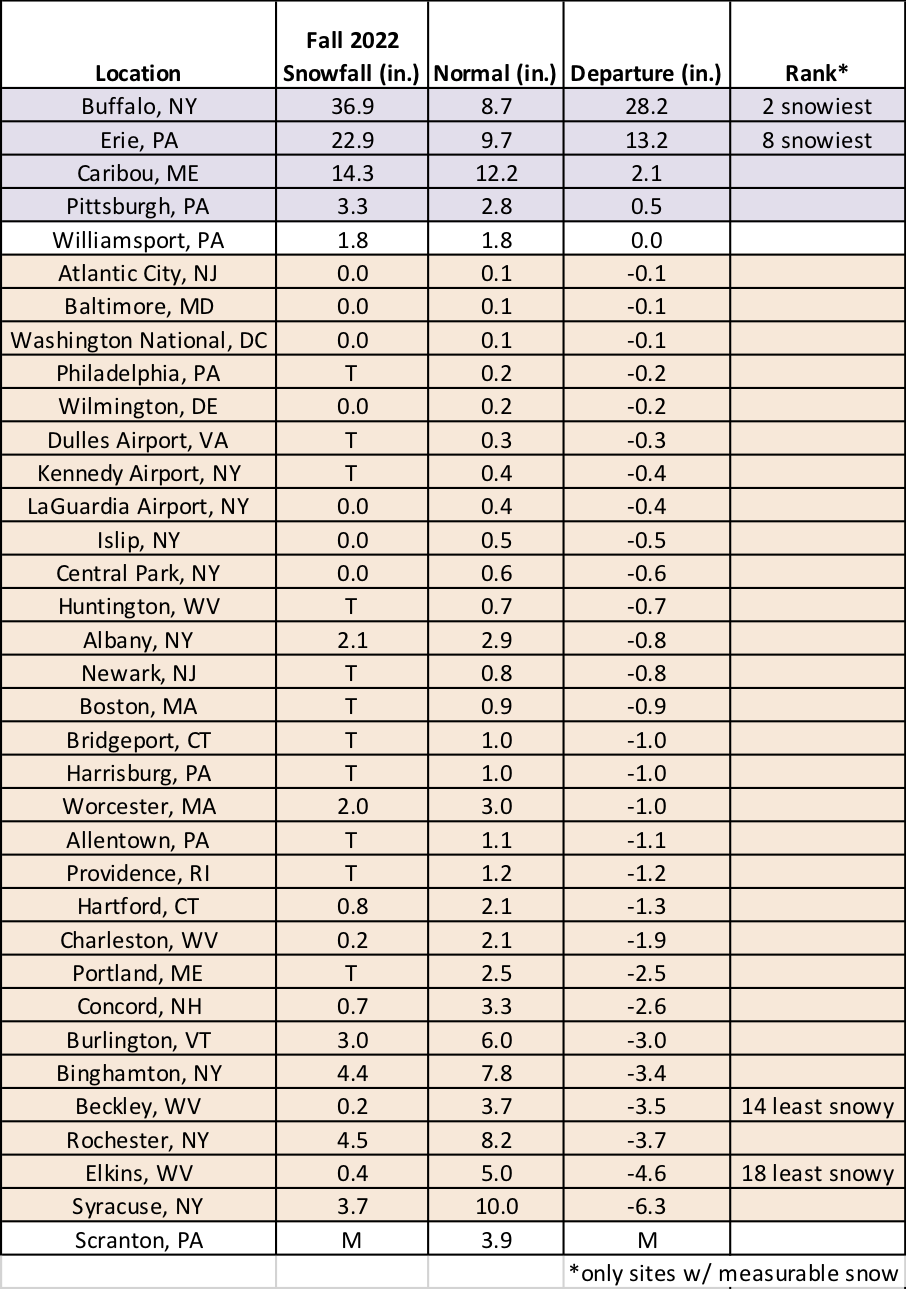
Fall 2022 ranked among the 20 least snowy falls on record for Beckley and Elkins, WV, but was among the 20 snowiest for Buffalo, NY, and Erie, PA.
December is expected to be cooler than normal for western parts of the Northeast shaded blue.
According to NOAA’s Climate Prediction Center, there’s an increased likelihood of below-normal temperatures for December for western portions of the Northeast including western and central New York, the western half of Pennsylvania, western Maryland, and most of West Virginia. Equal chances of below-, near-, or above-normal temperatures were predicted for the rest of the region.
There’s a tilt toward wetter-than-normal conditions for portions of West Virginia; otherwise, equal chances of below-, near-, or above-normal precipitation were predicted for the Northeast.
Areas shaded green could be wetter than normal for December.