Picking up Where January Left Off
You may recall that January featured temperature swings and was wetter but not necessarily snowier than normal. February so far has been similar.
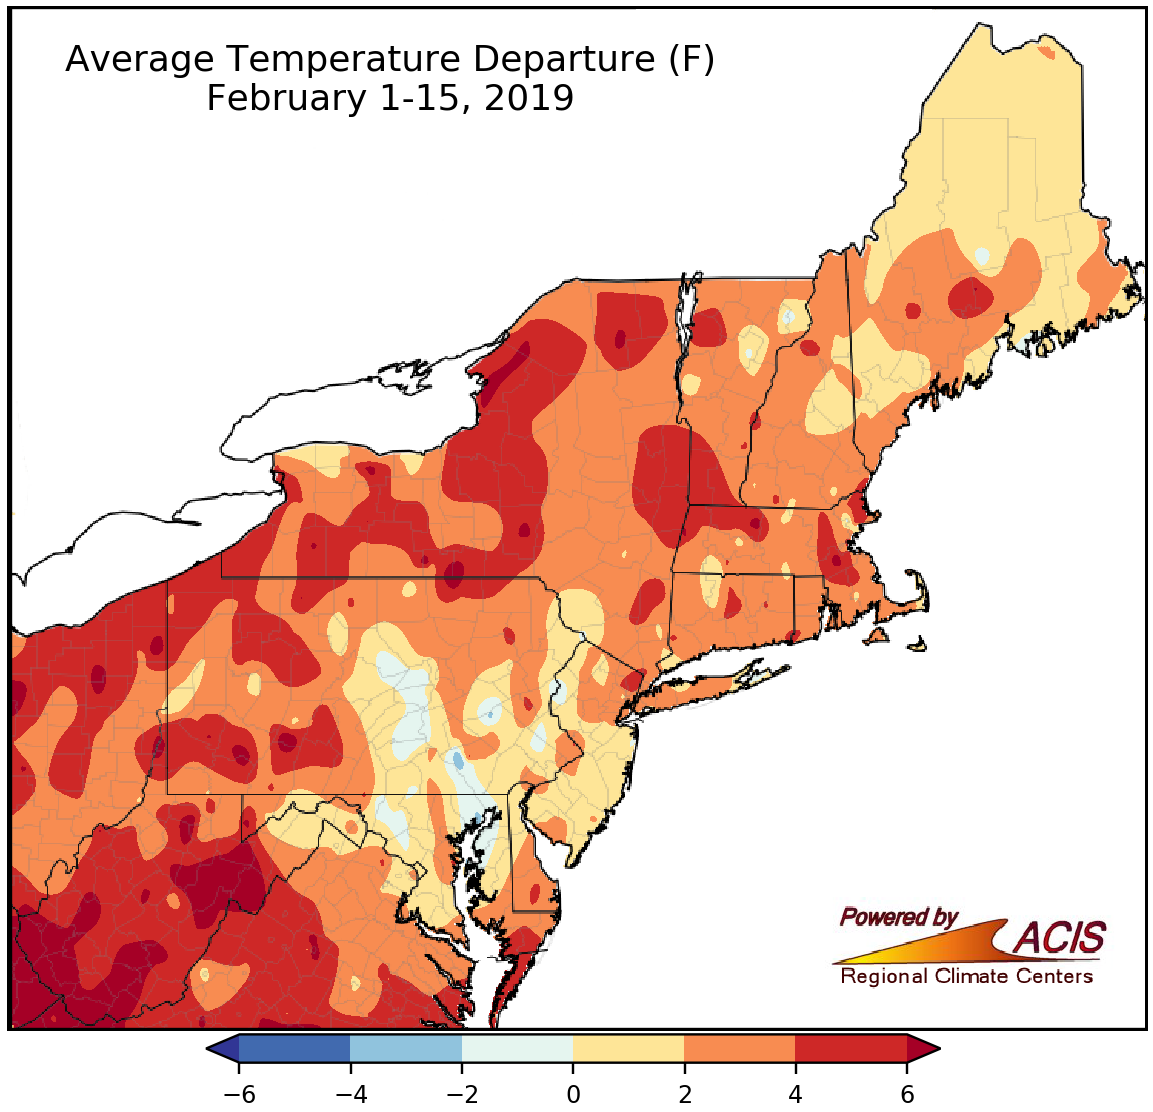
February 1-15 average temperatures ranged from near normal to more than 6°F above normal.
February kicked off with a cold spell followed by a big warm up a few days later. There was another brief cool down before temperatures returned to near or above normal. Despite the temperature rollercoaster, average temperatures for the first half of February ranged from near normal to more than 6°F above normal for most of the Northeast, with the warmest areas generally in West Virginia. The few cooler-than-normal areas, which were as much as 2°F below normal, were in Pennsylvania and Maryland. All 35 major climate sites were warmer than normal for the first half of February, with 25 ranking the period among their 20 warmest on record.
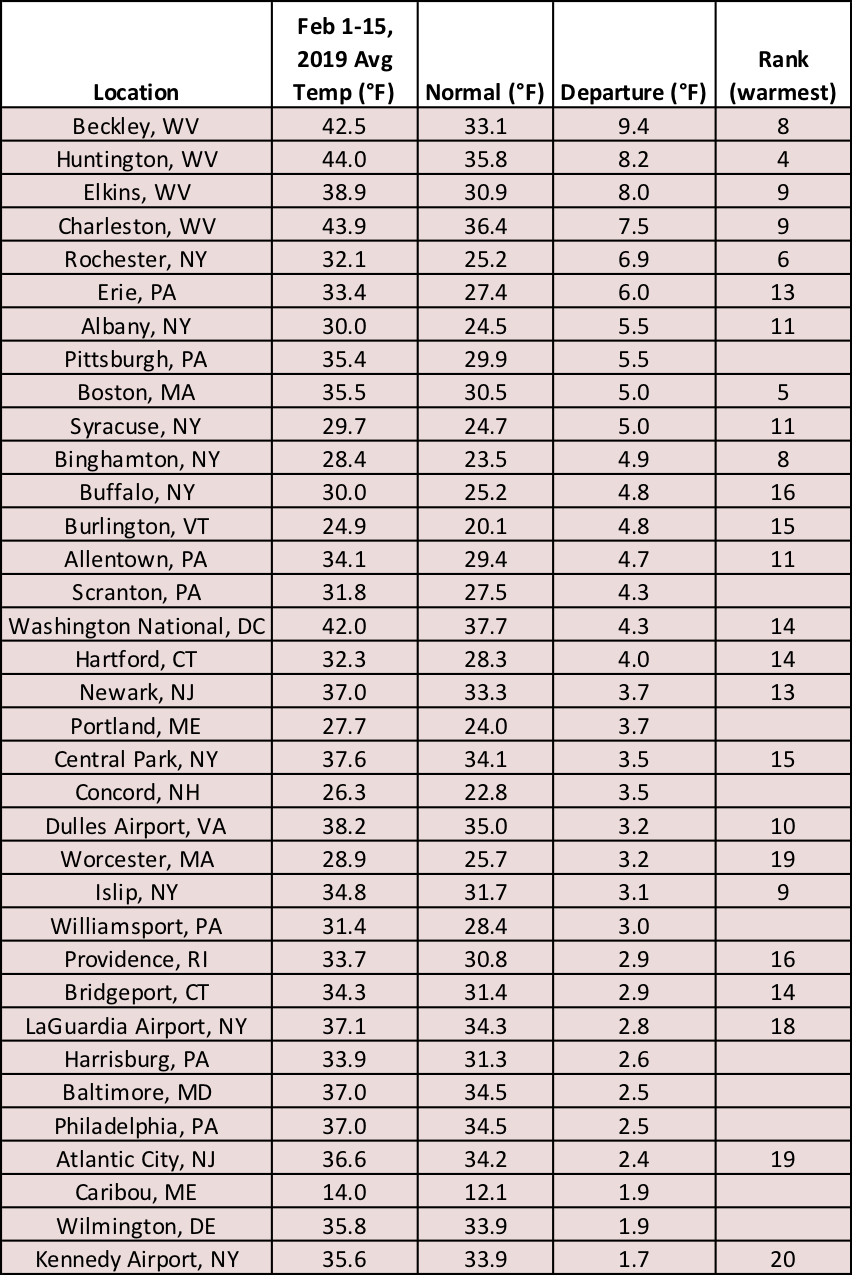
Twenty-five major climate sites ranked this February 1-15 period among their 20 warmest on record, with average temperatures between 1.7°F and 9.4°F warmer than normal.
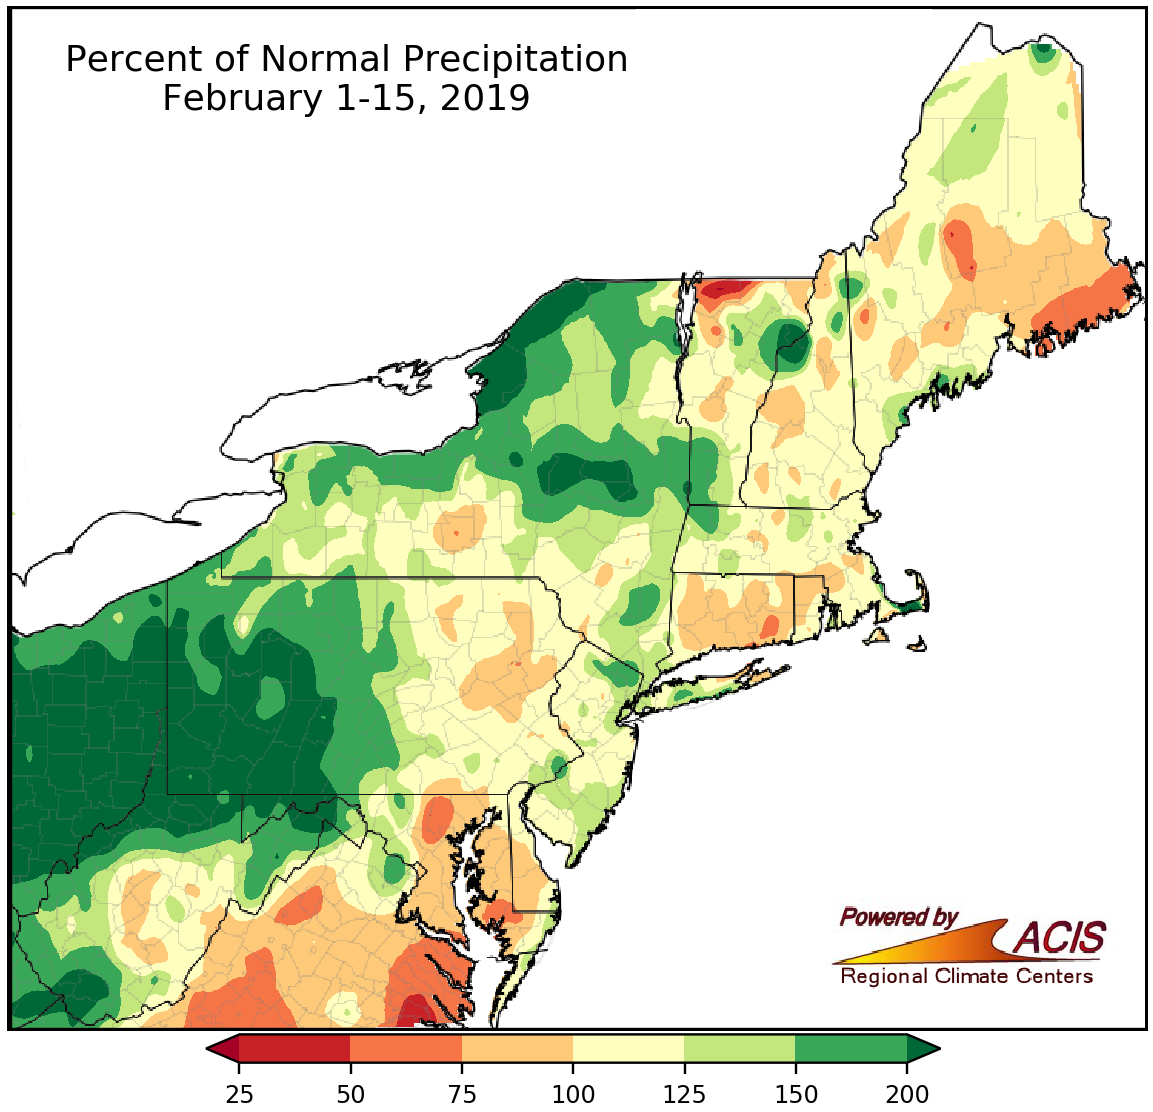
February 1-15 precipitation ranged from 50% of normal to more than 200% of normal, with many areas being wetter than normal.
A large portion of the Northeast experienced wetter-than-normal conditions during the first half of February, ranging from near normal to more than 200% of normal. The wettest areas were generally in the western half of Pennsylvania, parts if West Virginia, western Maryland, and portions of New York. On the other hand, the driest areas were generally found in eastern Maine and central and eastern Maryland, where precipitation was 50-75% of normal. Thirty-one of the region’s 35 major climate sites were wetter than normal, with four ranking this February 1-15 period among their 20 wettest.
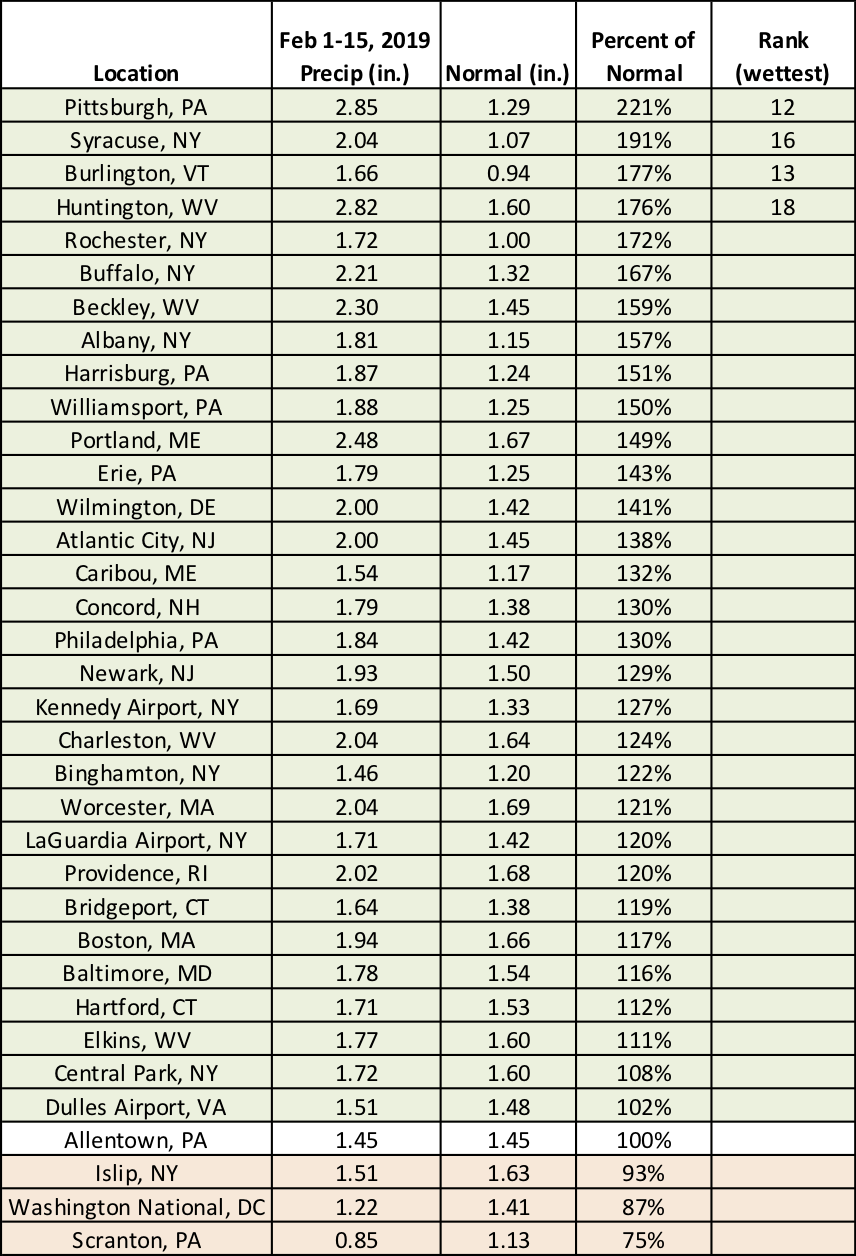
Four of the region’s 31 wetter-than-normal major climate sites ranked this first half of February among their 20 wettest on record.
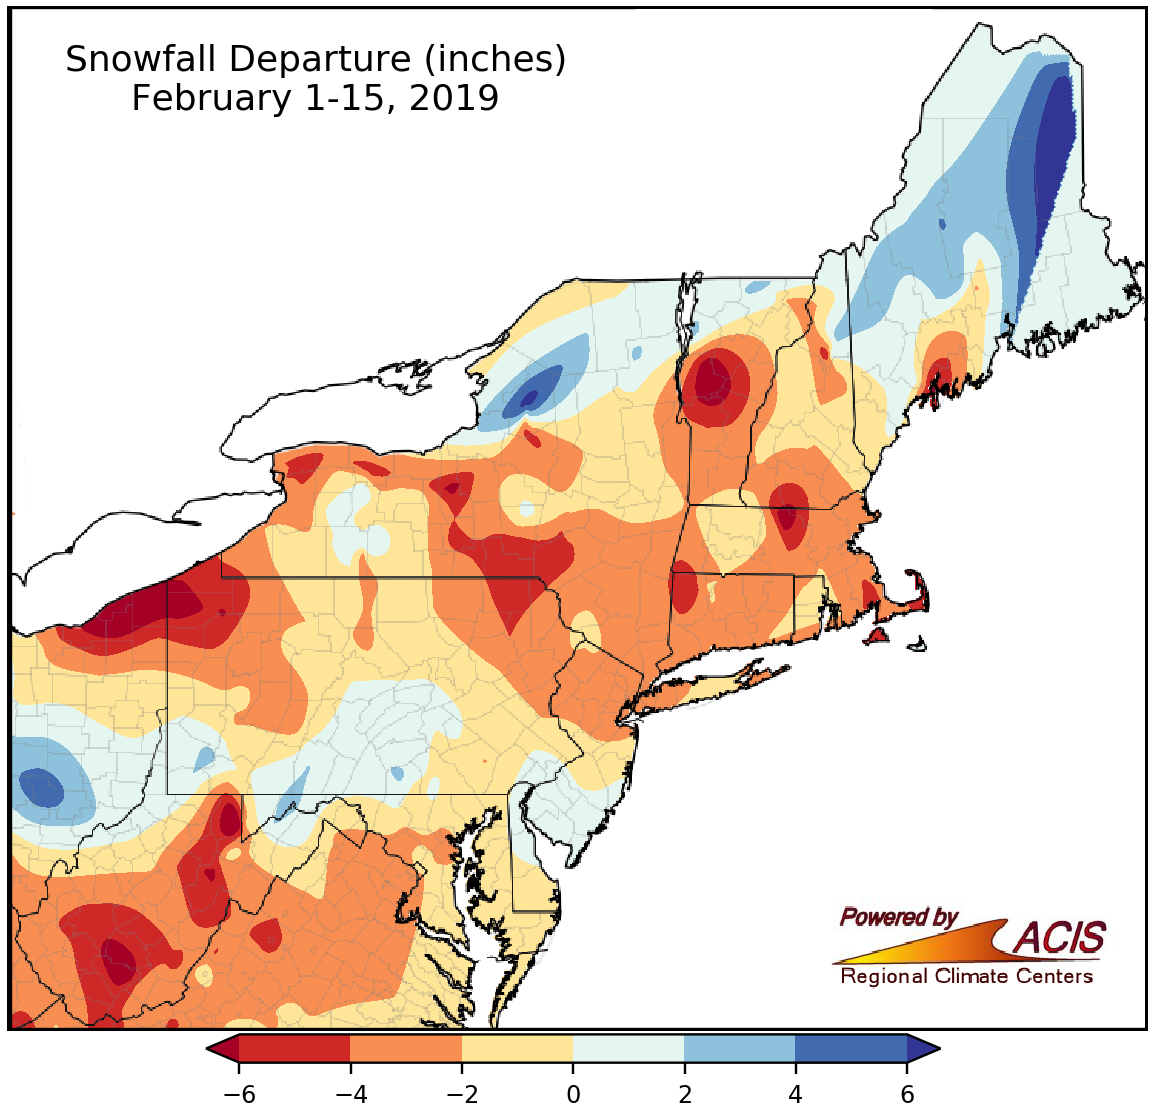
February 1-15 snowfall ranged from more than 6 inches blow normal to more than 6 inches above normal.
While February-to-date was wetter than normal for many areas, it wasn’t necessarily snowier than normal due to the warmer-than-normal temperatures. Snowfall during the first half of February ranged from more than 6 inches below normal in parts of West Virginia, northwestern Pennsylvania, and central Vermont to more than 6 inches above normal in northern Maine and east of Lake Ontario in New York. Twenty-nine of the region’s 35 major climate sites had a snowfall deficit during the first half of February, with three ranking the period among their 20 least snowy on record. Conversely, two of the five snowier-than-normal sites ranked the period among their 20 snowiest.
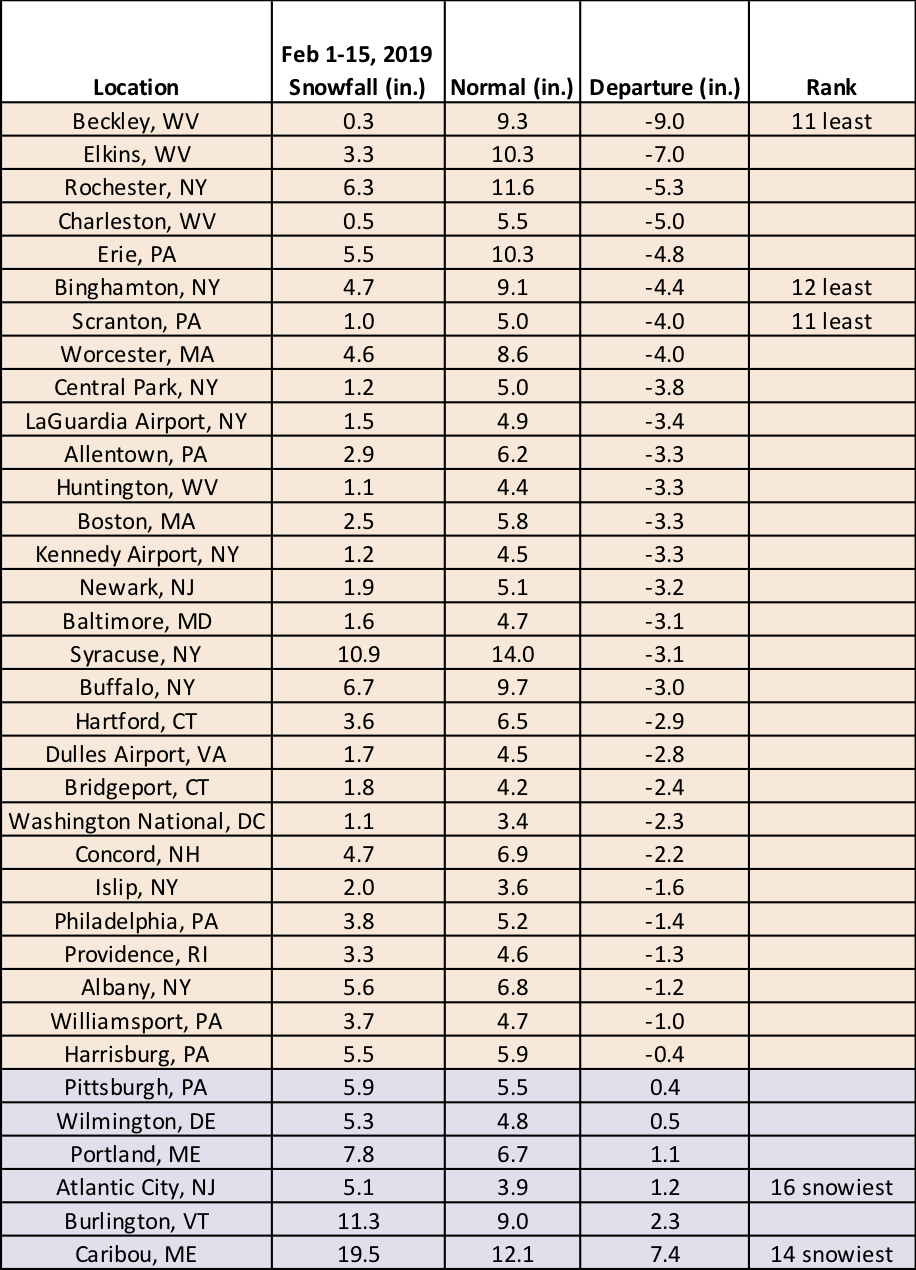
Snowfall during the first half of February ranged from 9 inches below normal in Beckley, WV, to 7.4 inches above normal in Caribou, ME.