Mid-July - Variable Rainfall, Warm Temperatures
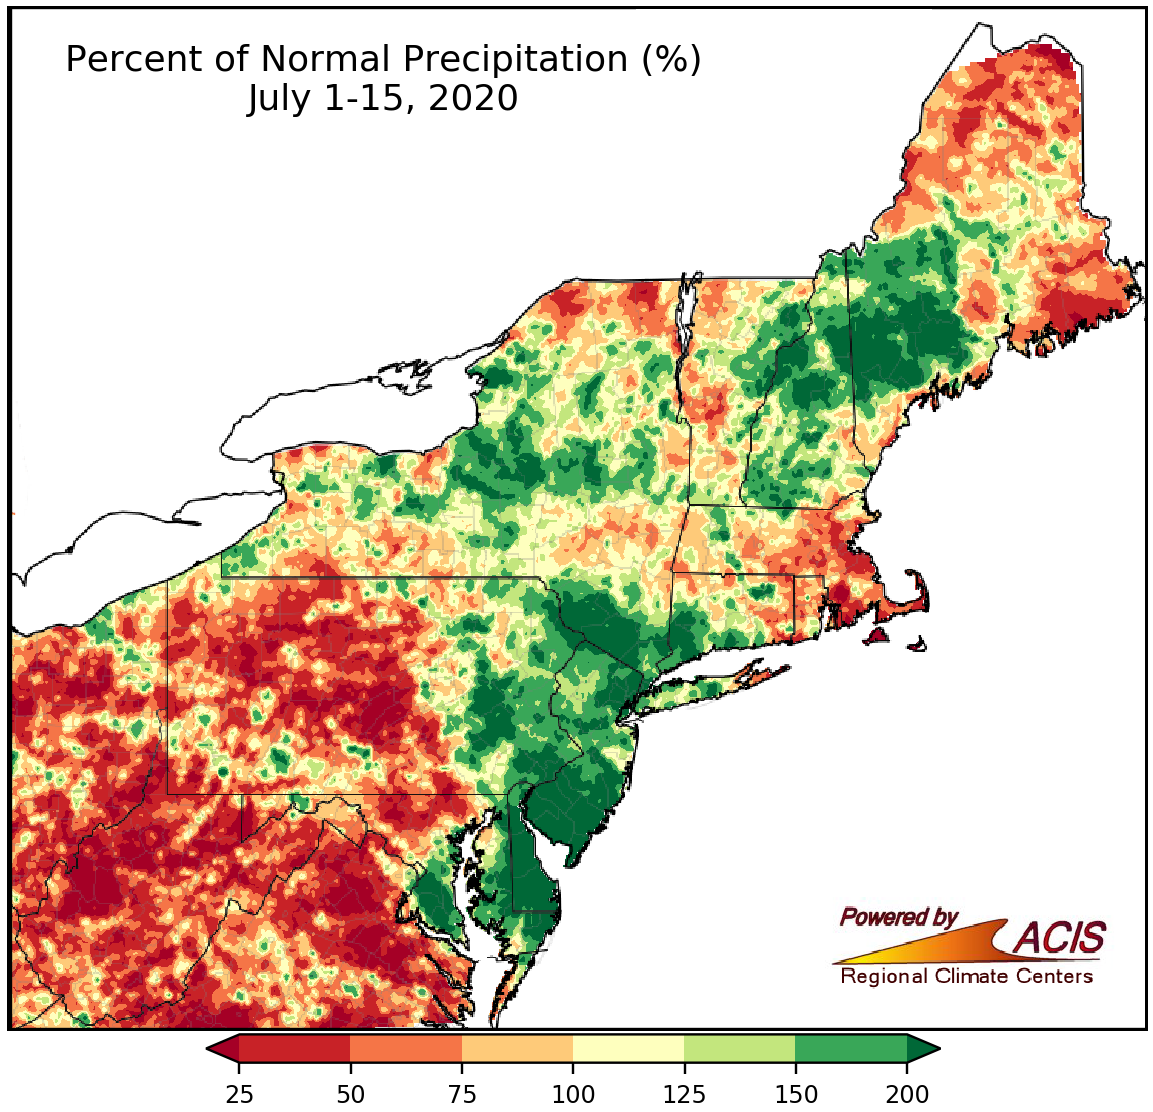
July 1-15 rainfall ranged from less than 25% of normal to more than 200% of normal.
July 1-15 rainfall was extremely variable, ranging from less than 25% of normal to more than 200% of normal. Some of the driest locations were in West Virginia and western/central Pennsylvania. Twenty of the 35 major climate sites were drier than normal during the first half of July, with three ranking this period among their 15 driest. Drought and abnormally dry conditions lingered in much of New England, eastern/northern New York, and western/central Pennsylvania, and expanded in some of the drier locations of West Virginia. Some of the wettest locations were in western Maine, northern New Hampshire, and coastal areas from southwestern Connecticut down to southern Maryland. Eleven of the 15 wetter-than-normal major climate sites ranked this first half of July among their 20 wettest, with Newark, NJ, and Bridgeport, CT, being record wet. Above-normal rainfall eased dryness in parts of western Maine, western/southeastern New York, eastern Pennsylvania, central/southern New Jersey, and Delaware.
There were only two days during the first half of July without flash flooding or some type of severe weather in the Northeast. Thunderstorms dumped localized heavy rain in some areas. For instance, Bridgeport, CT, had its second wettest July day on record on the 3rd with 3.99 inches of rain. One particularly notable event was severe flash flooding in the northern suburbs of Philadelphia, PA, on July 6. Between 4 and 6 inches of rain caused rapid rises on some waterways, closing numerous roads, submerging vehicles, and leading to dozens of water rescues. A rare flash flood emergency was issued by the Philadelphia/Mt. Holly National Weather Service office. In addition, Tropical Storm Fay made landfall in New Jersey on July 10 and dropped between 2 and 6 inches of rain on parts of Maryland, Delaware, eastern Pennsylvania, New Jersey, southeastern New York, and southwestern Connecticut. In fact, Philadelphia, PA, had its fourth wettest July day on record with 4.15 inches on July 10.
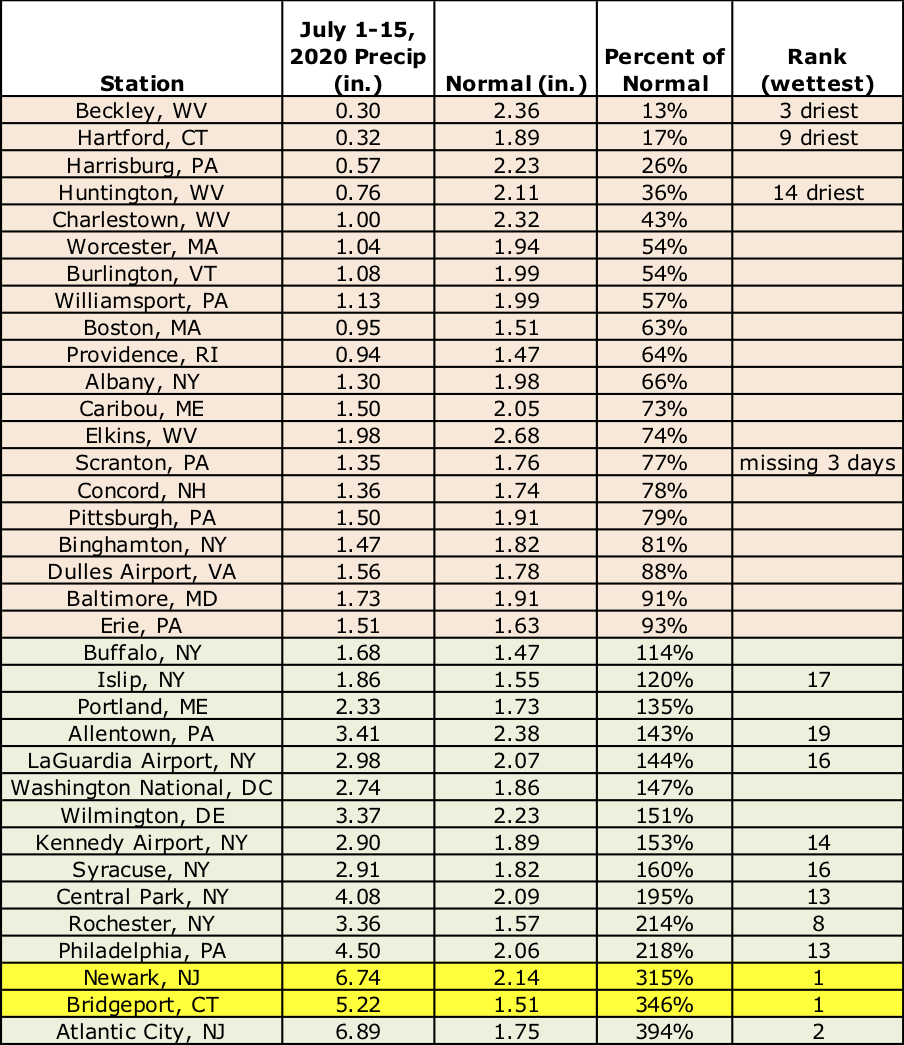
Newark, NJ, and Bridgeport, CT, had their wettest first half of July on record.
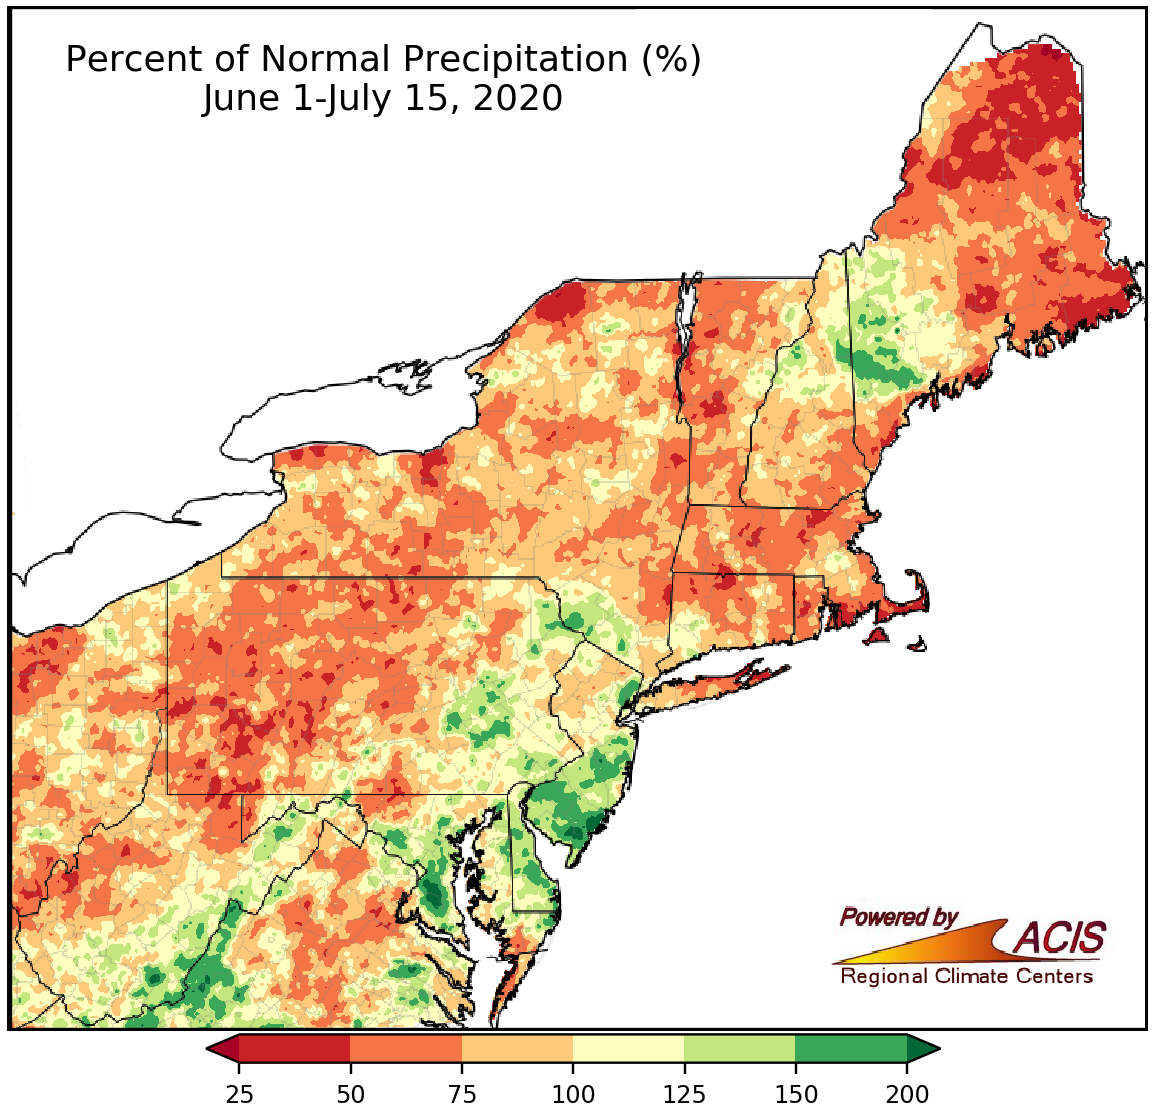
Much of the Northeast received near- or below-normal precipitation from June 1-July 15.
A drier signal emerged for more areas in the June 1-July 15 period, with precipitation ranging from 50% of normal to near normal for many locations. Northwestern New York and northern/eastern Maine were drier, seeing less than 50% of normal rainfall, while some areas including western Maine, southern New Jersey, southern Maryland, and parts of Delaware were wetter, seeing up to 200% of normal. At the 35 major climate sites, June 1-July 15 rainfall ranged from 25% of normal in Hartford, CT, to 195% of normal in Atlantic City, NJ. Overall, 23 of the sites received below-normal precipitation, with five ranking this June 1-July 15 period among their 20 driest. Conversely, four of the 12 wetter-than-normal sites ranked the period among their 20 wettest.
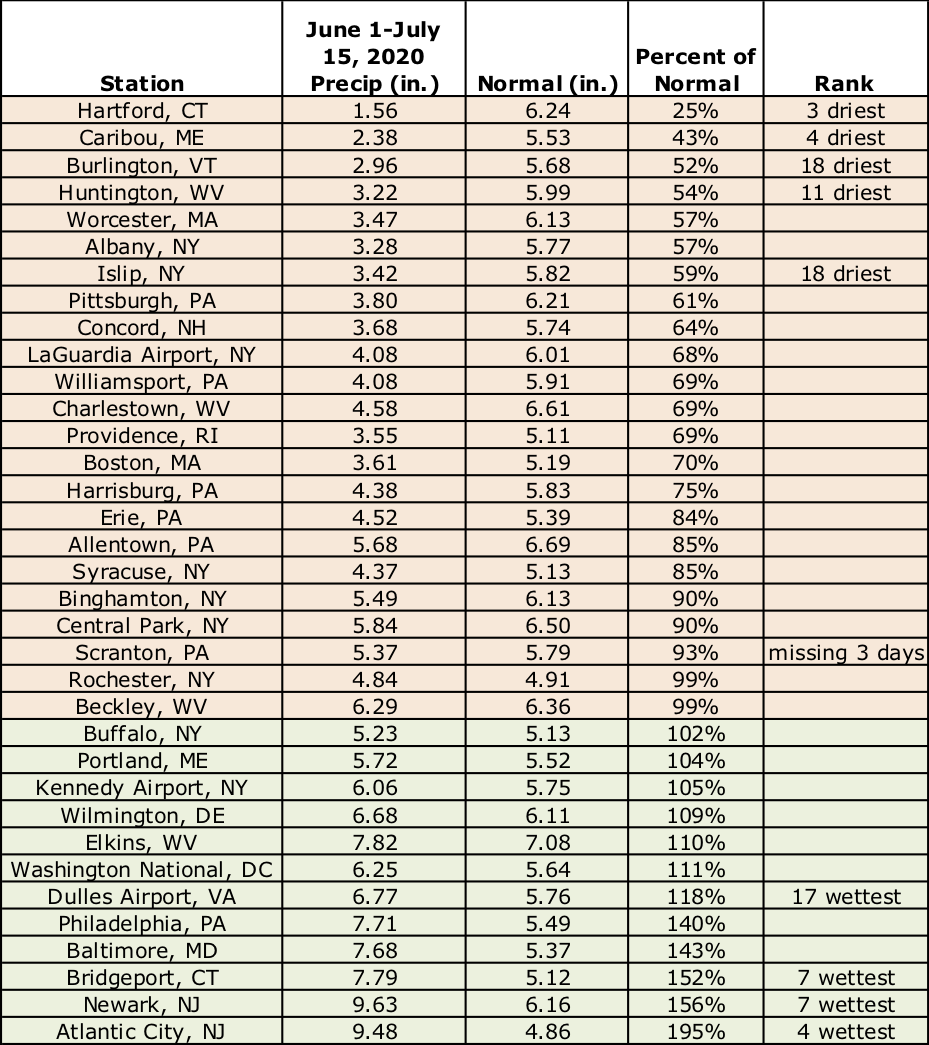
June 1-July 15 precipitation at the major climate sites ranged from 25% of normal in Hartford, CT, to 195% of normal in Atlantic City, NJ.
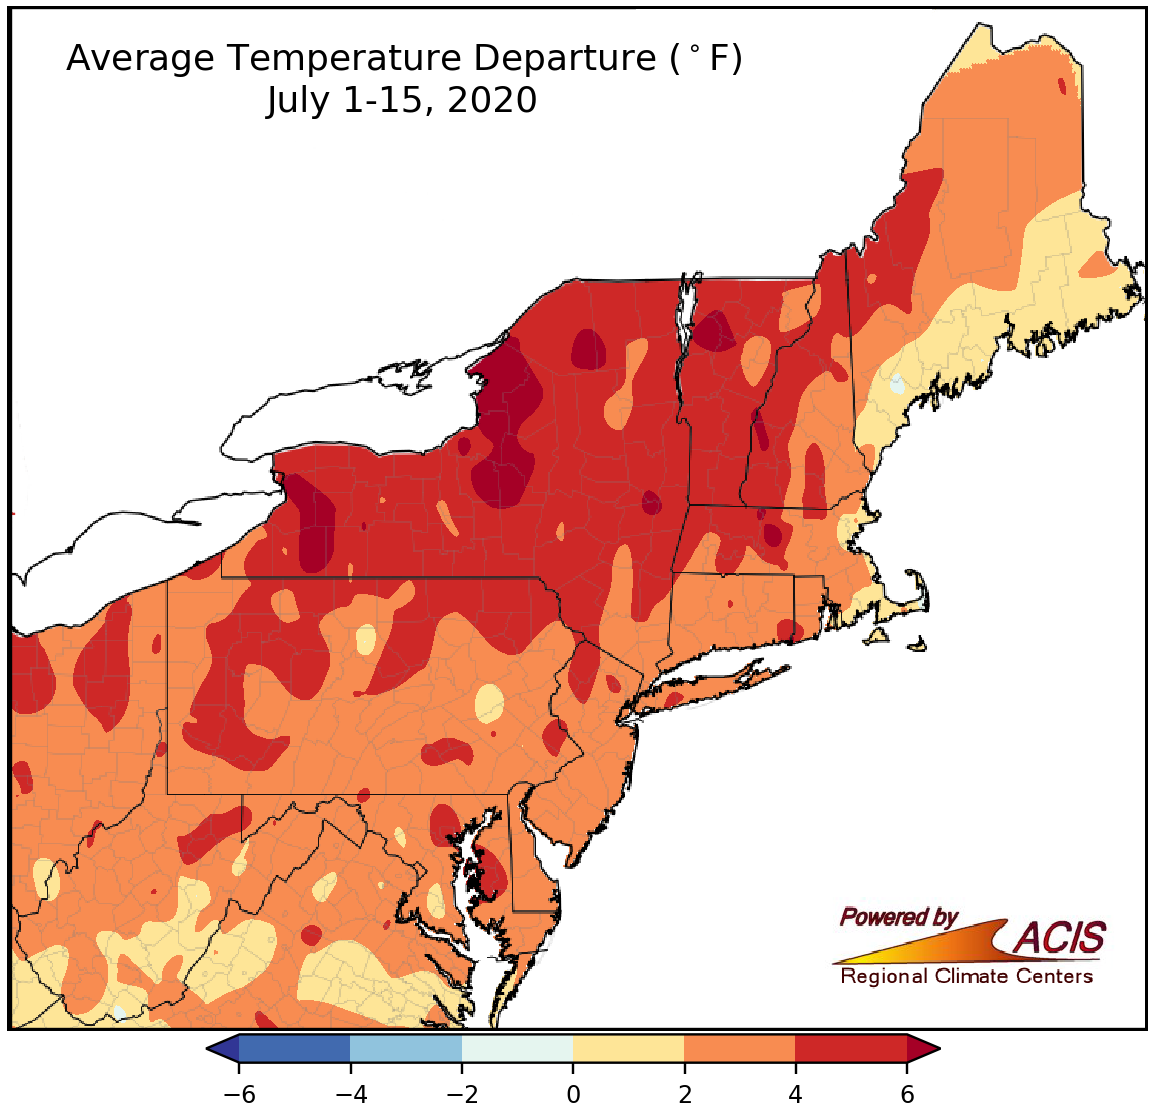
July 1-15 average temperatures ranged from near normal to more than 6°F above normal.
Almost the entire Northeast experienced warmer-than-normal temperatures during the first half of July. The hottest locations were more than 6°F above normal and were generally found in New York and Vermont. Thirty-four of the 35 major climate sites were warmer than normal, with 33 ranking this first half of July among their 20 hottest on record. In fact, in Buffalo, NY, this first half of July was record hot. The site experienced extreme heat on July 9 and 10. Buffalo’s high of 98°F on July 9 was the site’s hottest July temperature on record and tied as the site’s second all-time hottest temperature. The following day, Buffalo’s high of 97°F tied as its second hottest July temperature and fourth all-time hottest temperature.
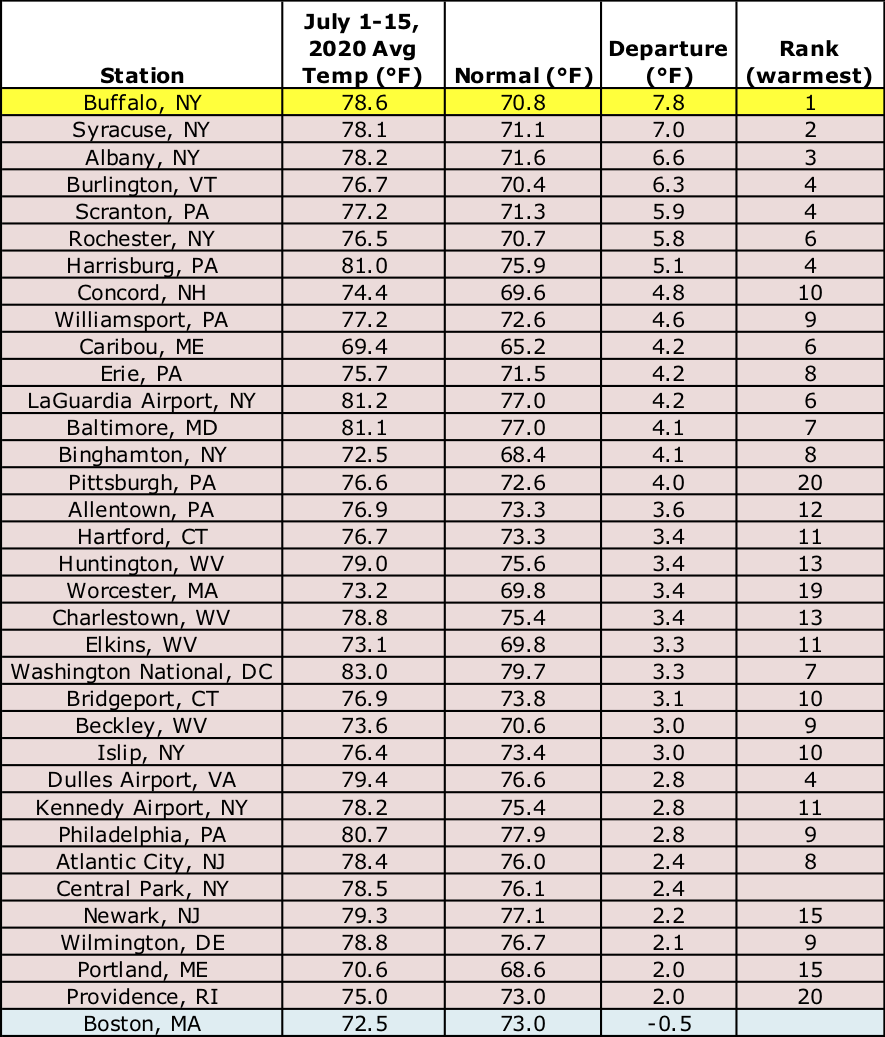
Buffalo, NY, had its hottest July 1-15 period on record, with another 32 sites ranking the period among their 20 hottest.
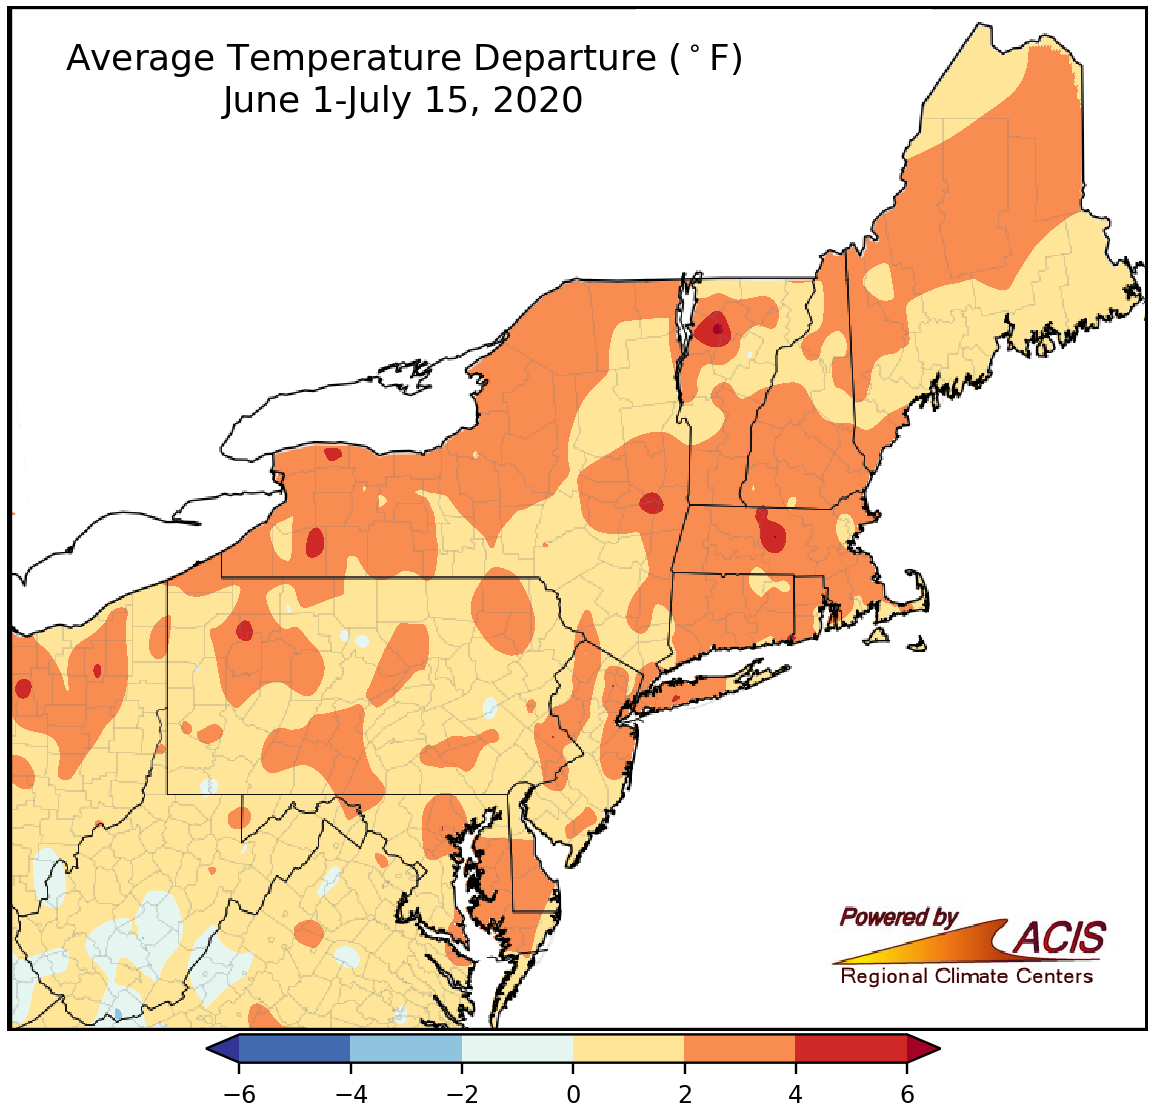
June 1-15 average temperatures ranged from 2°F below normal to 6°F above normal.
A majority of the Northeast was warmer than normal during the June 1-July 15 period, with average temperatures ranging from near normal to 6°F above normal. The hottest locations were generally found in parts in New York and New England. All 35 major climate sites were warmer than normal, with 30 sites ranking this June 1-July 15 period among their 20 hottest on record. In fact, the period was record hot for Albany, NY; Caribou, ME; and Portland, ME.
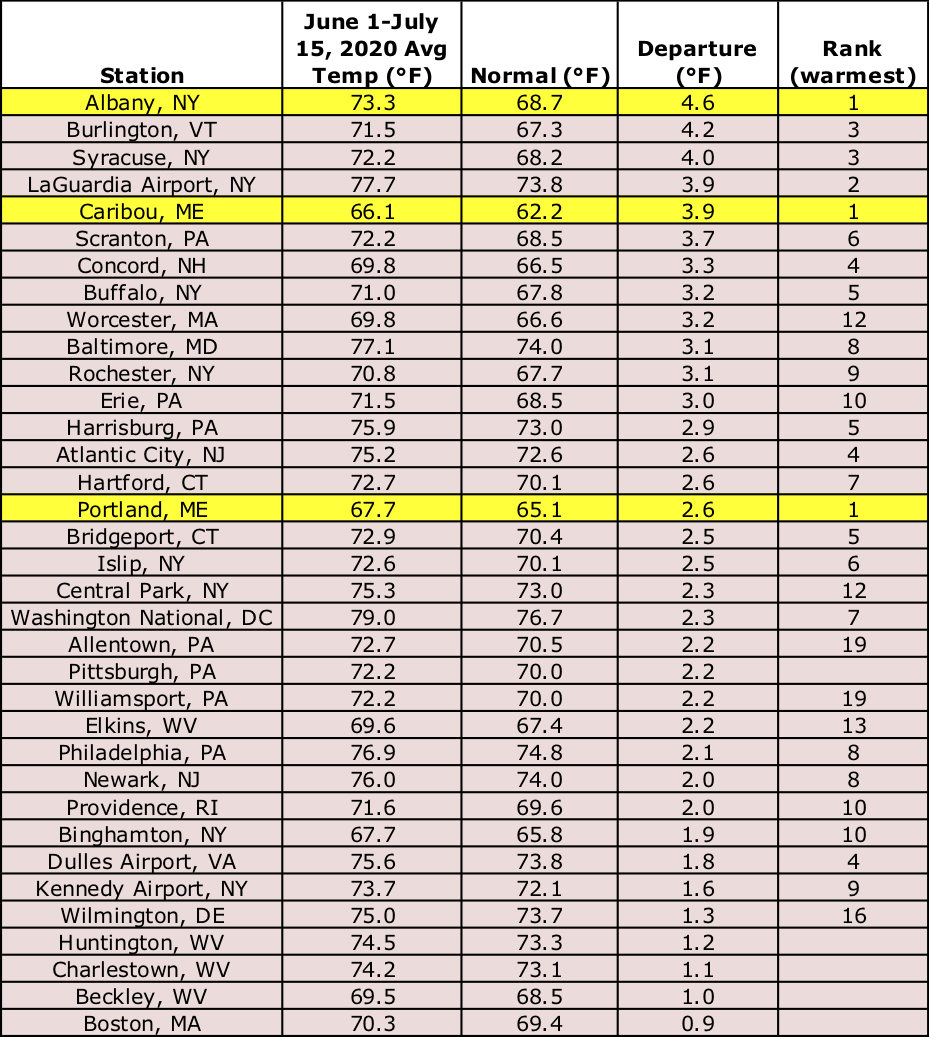
Albany, NY; Caribou, ME; and Portland, ME, had their hottest June 1-July 15 period on record.
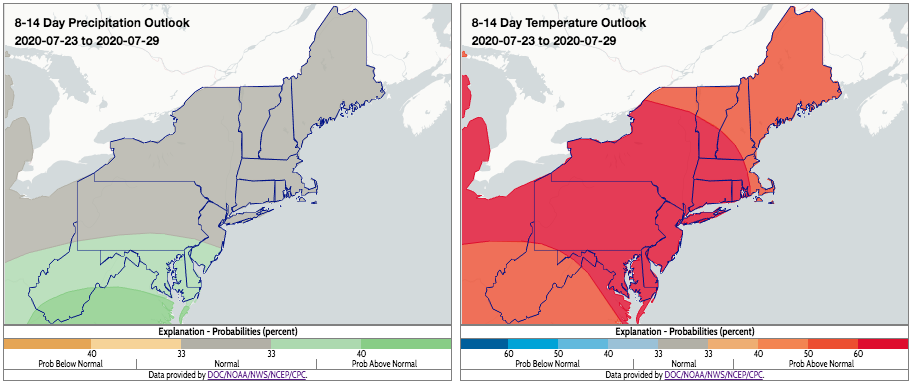
The Northeast is expected to be warm for the rest of July, with near- to above-normal precipitation. Click to enlarge.
For the remainder of July, NOAA’s Climate Prediction Center indicates an increased chance of above-normal temperatures for the entire Northeast. For precipitation, there’s a slight tilt towards above-normal precipitation for southern locations, with normal precipitation favored in northern locations. For August, the Climate Prediction Center indicates an increased chance of above-normal temperatures for the entire Northeast. The precipitation outlook calls for an increased likelihood of above-normal precipitation for much of West Virginia, with equal chances of below-, near-, or above-normal precipitation for the rest of the region.