February - The Amusement Park Edition
February was like an amusement park - from record highs and record lows to blizzards and tornadoes, there were surprises around every corner. Winter also featured some extremes.
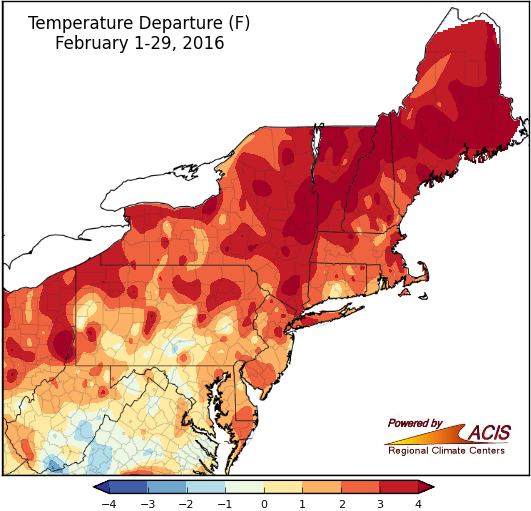
February average temperatures ranged from near normal to 4°F above normal for most of the Northeast.
February temperatures were like a rollercoaster - they started off climbing high, came plummeting down, then had a couple of smaller ups and downs after. Overall, the month wrapped up to be near to above normal for a majority of the region. Average temperature departures ranged from 2°F below normal in a few spots in West Virginia to more than 4°F above normal in parts of northern New England and New York. Of the region’s 35 major airport climate sites, 20 sites ranked this February among their top 20 warmest.
Due in part to a record-warm December, this winter will likely rank as one of the warmest on record for the Northeast. Average temperatures were 2°F to 8°F above normal, with the warmest spots in northern New England and New York. Eight airport climate sites had their warmest winter on record. The rest of the sites were warmer than normal, as well, with all but one ranking the season among their top 20 warmest.
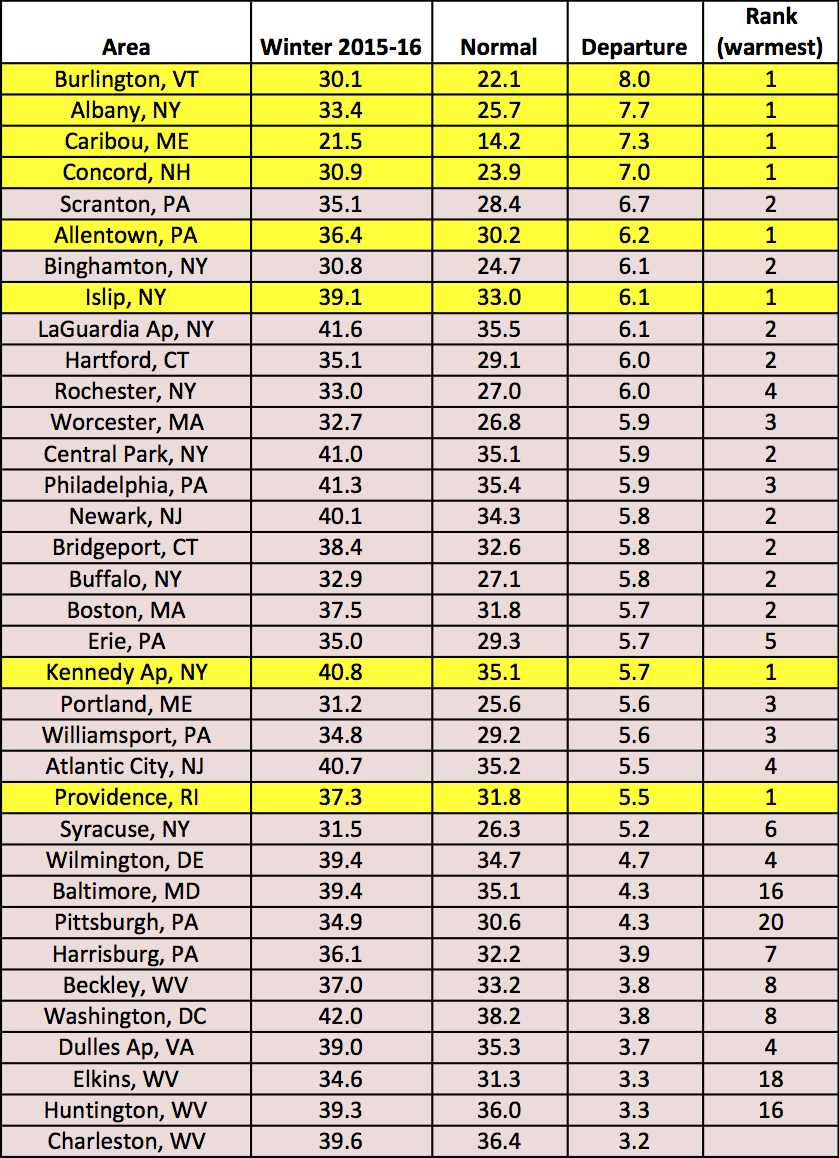
Winter temperatures were 3°F to 8°F above normal, with eight sites record warm for the season.
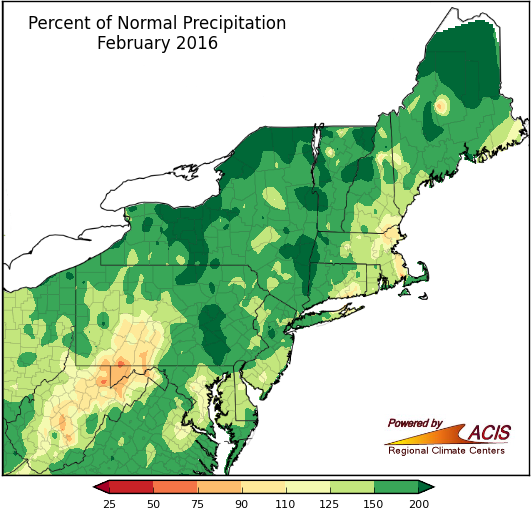
February precipitation ranged from 75% of normal to more than 200% normal.
In terms of precipitation, February was like the log flume - when it ended, most areas were wet. Precipitation generally ranged from 110% of normal to more than 200% of normal, with the wettest areas in parts of eastern Pennsylvania, New York, and northern New England. There were a few spots in West Virginia, western Maryland, and south-central Pennsylvania that saw near to below-normal precipitation, though. Thirty-four airport climate sites were wetter than normal, with 24 sites ranking the month among their top 20 wettest.
The winter season wrapped up with near to above-normal precipitation, with most areas seeing 90% to 150% of normal. Of the 33 airport climate sites that saw above-normal winter precipitation, 15 sites ranked the season among their top 20 wettest.
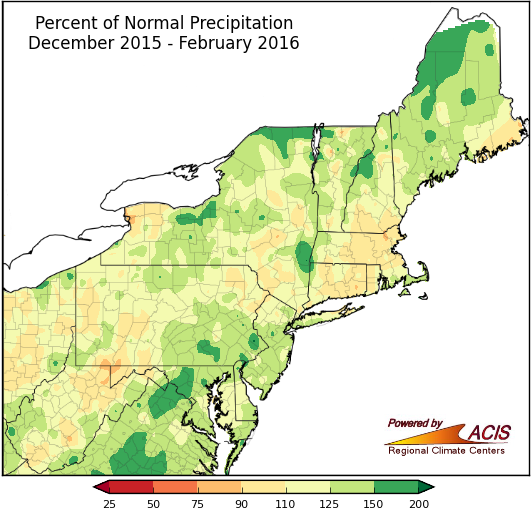
Winter precipitation ranged from 90% to 200% of normal.
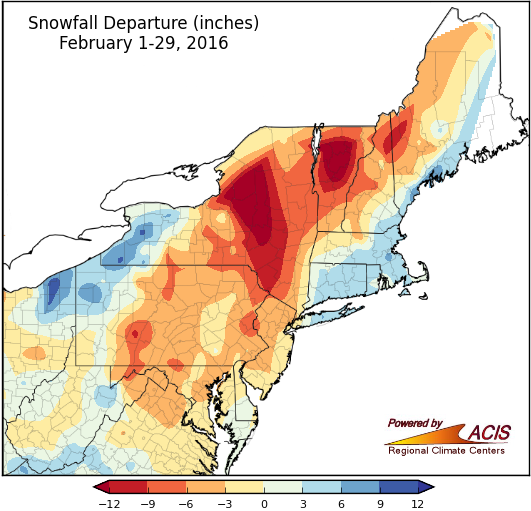
February snowfall ranged from more than a foot below normal to 9 inches above normal.
February snowfall was like the Scrambler - all mixed up. The usually snowy areas of northern New York and northern Vermont were more than a foot below normal for February snowfall. In fact, much of the central portion of the region saw near to below-normal snowfall. However, western New York, northwestern Pennsylvania, coastal New England, and Long Island were 3 to 9 inches above normal for February snowfall. Twenty-three airport climate sites saw below-normal snowfall.
Winter snowfall ranged from below normal to within 6 inches of normal for much of the region. The largest departures of more than 30 inches were in New York. Binghamton and Albany both had their least snowy winters on record, with departures of more than 33 inches. Seventeen other sites saw below-normal snowfall, with six of those ranking the season among their top 20 least snowy. However, areas hit by the January blizzard were up to 18 inches above normal for seasonal snowfall. Of the 16 snowier-than-normal airport climate sites, 9 sites ranked the season among their top 20 snowiest.
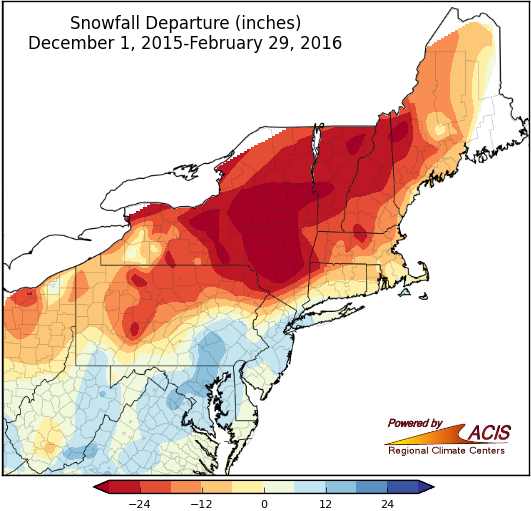
Winter snowfall ranged from more than 30 inches below normal to 18 inches above normal.
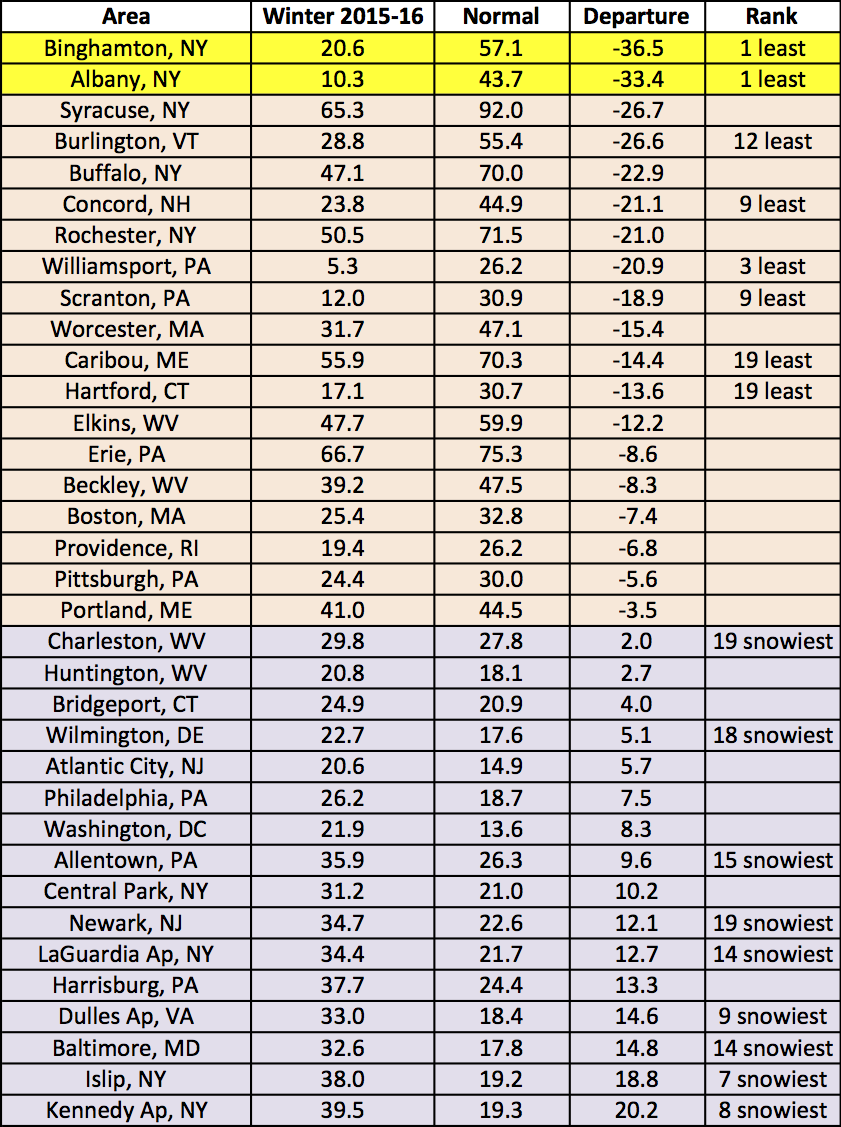
Two airport climate sites had record low snowfall during winter.