That’s a Wrap, January
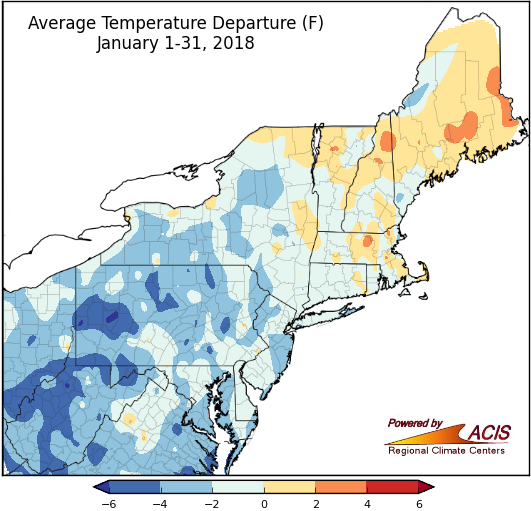
For a large portion of the Northeast, January average temperatures were below normal, indicated by the blue colors on the map.
While January started off cold, the rest of the month featured alternating periods of warmer temperatures and colder temperatures. For most of the region, the month wrapped up on the cold side of normal, with average temperatures ranging from 6°F below normal to normal. There were a few warmer areas in parts of New York and New England where temperatures were up to 4°F above normal. Twenty-eight of the region’s 35 major climate sites were colder than normal for January.
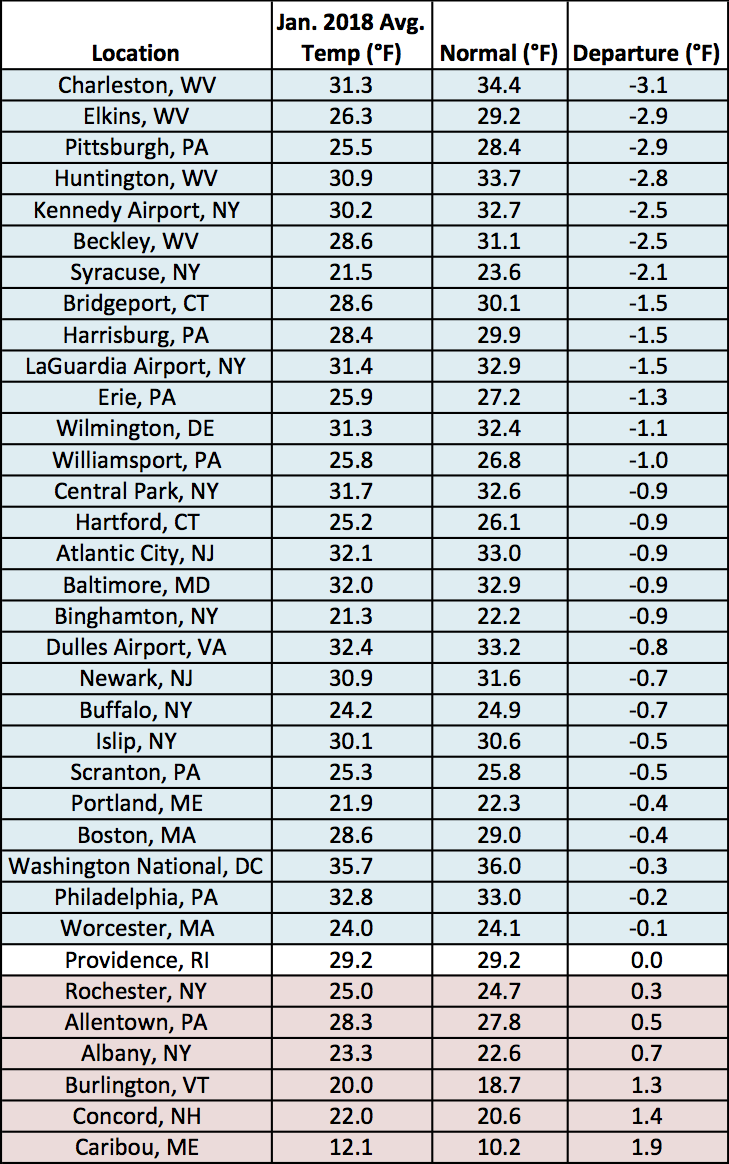
January average temperatures at the major climate sites ranged from 3.1°F below normal in Charleston, WV, to 1.9°F above normal in Caribou, ME.
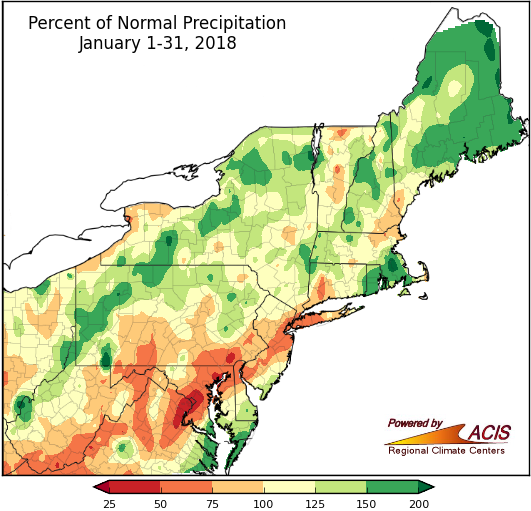
January precipitation varied, ranging from 25% of normal to more than 200% of normal.
While January precipitation ranged from 25% of normal to more than 200% of normal, much of the region wrapped up the month in the 75% to 200% range. The driest areas were in central and southern Maryland and southeastern Pennsylvania, where drought conditions lingered. In fact, severe drought was introduced in Maryland in late January. The 35 major climate sites were nearly split, with 16 sites being drier than normal and 19 sites being wetter than normal. This January ranked among the 20 driest at five sites and among the 20 wettest at three sites.
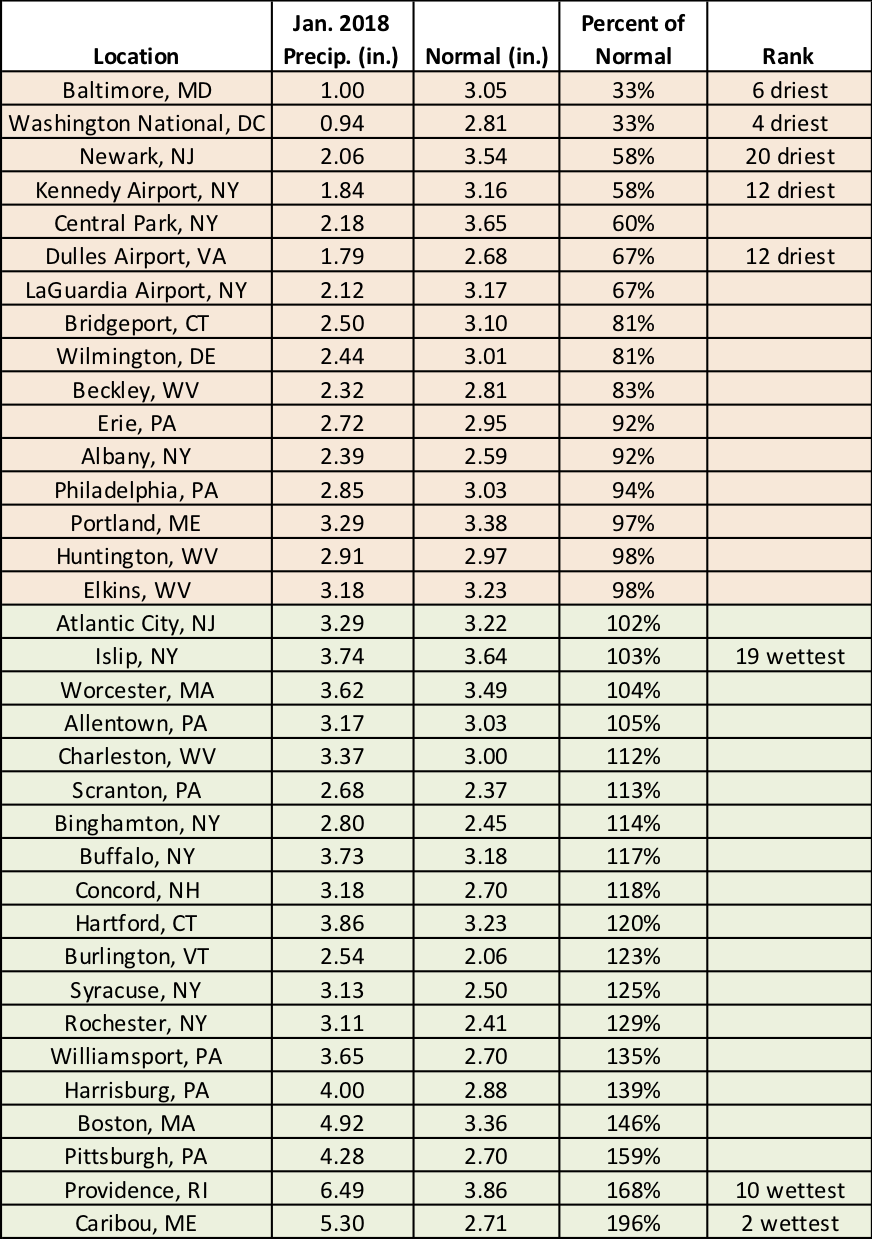
January precipitation at the major climate sites ranged from 33% of normal in Baltimore, MD, to 196% of normal in Caribou, ME.
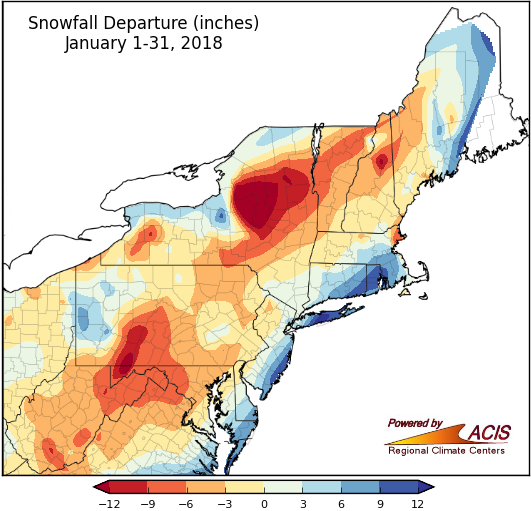
Snowfall for January ranged from more than 12 inches below normal to 12 inches above normal.
January started off with a major storm that brought up to 24 inches of snow to mainly coastal areas from eastern Maryland to northern Maine. Many of those areas wrapped up January with a surplus of snowfall, with the largest surpluses of up to 12 inches in coastal New Jersey, Long Island, parts of southern New England, and eastern and northern Maine. There were also some areas in western Pennsylvania and south of Lake Ontario in New York that were snowier than usual. The rest of the region, though, tended to receive below-normal snowfall. The largest deficits of more than 12 inches were in western Maryland, south-central Pennsylvania, and east of Lake Ontario in New York. Again, the 35 major climate sites were nearly split, with 18 sites seeing below-normal snowfall and 17 sites seeing above-normal snowfall. While Dulles Airport, VA, had its sixth least snowy January on record, six other sites ranked this January among their 20 snowiest.
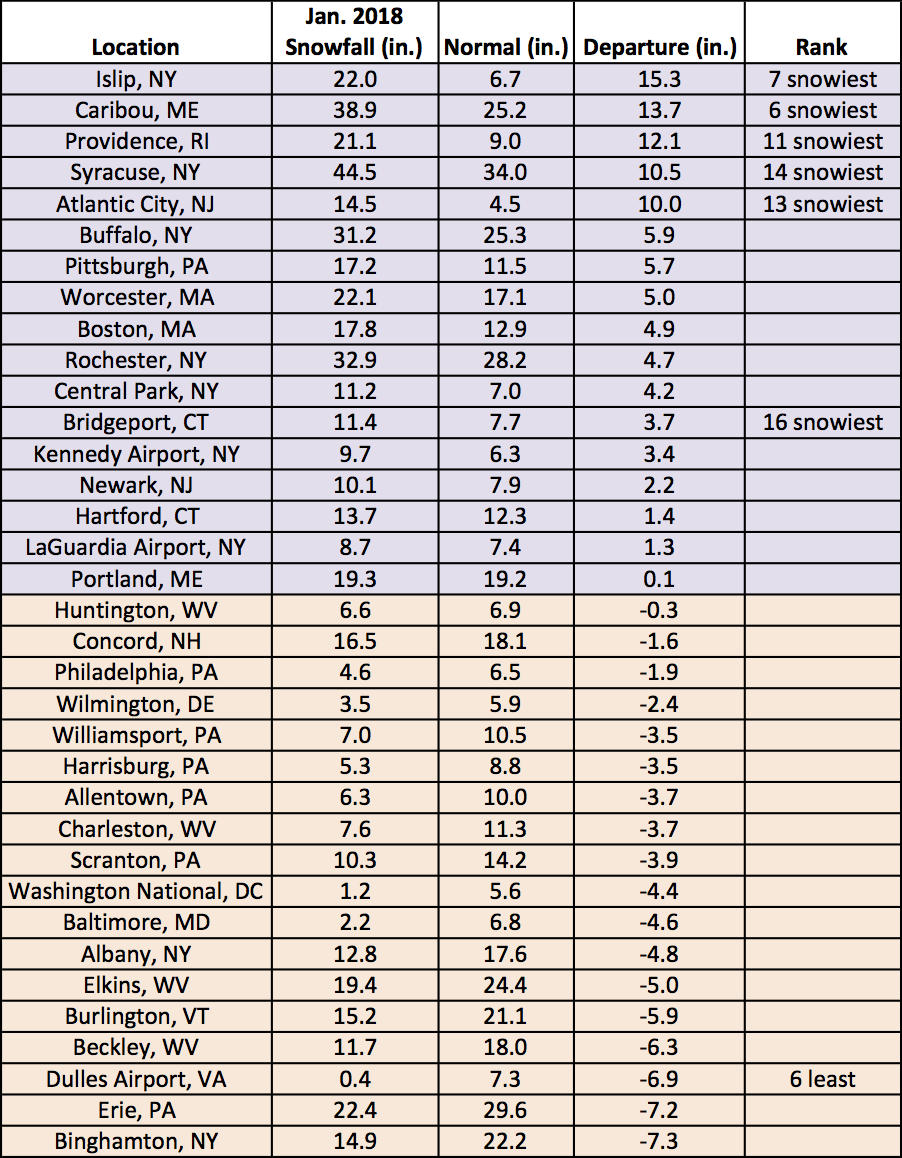
January snowfall at the major climate sites ranged from 7.3 inches below normal in Binghamton, NY, to 15.3 inches above normal in Islip, NY.
On February 2, Punxsutawney Phil predicted six more weeks of winter. Perhaps he consulted the Climate Prediction Center’s (CPC) February outlooks before making his prediction? According to CPC, there’s an increased likelihood of below-normal temperatures for February for all of the Northeast except the southern half of West Virginia and parts of southern and eastern Maryland. CPC is also calling for increased chances of above-normal precipitation for February for all of the Northeast except parts of southern West Virginia and southeastern Maryland.
NOAA’s Climate Prediction Center February temperature outlook indicates increased chances of below-normal temperatures for most of the Northeast.
The February precipitation outlook indicates increased chances of above-normal precipitation for most of the Northeast.