Middle of April, Middle of Spring
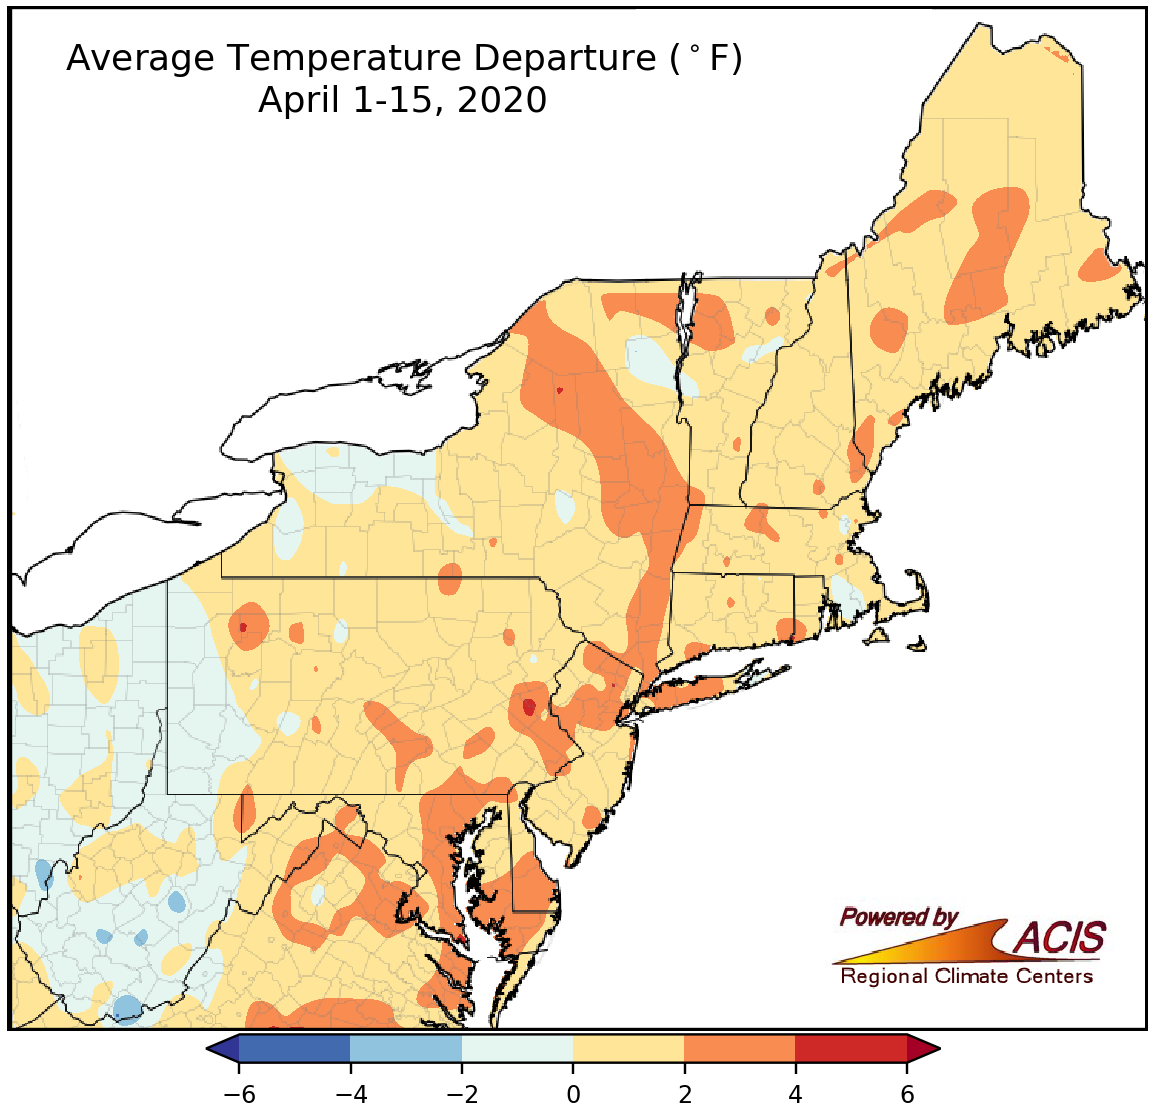
April 1-15 average temperatures ranged from 4°F below normal to 4°F above normal.
Average temperatures during the first half of April ranged from 4°F below normal in a few locations in West Virginia to 4°F above normal in many areas scattered throughout the Northeast, with most areas seeing near- to above-normal temperatures. Twenty-nine of the region’s 35 major climate sites were warmer than normal, with eleven of the sites ranking this first half of April among their 20 warmest. Overall, average temperatures at the sites ranged from 1.6°F below normal in Charleston, WV, to 5.2°F above normal in Allentown, PA.
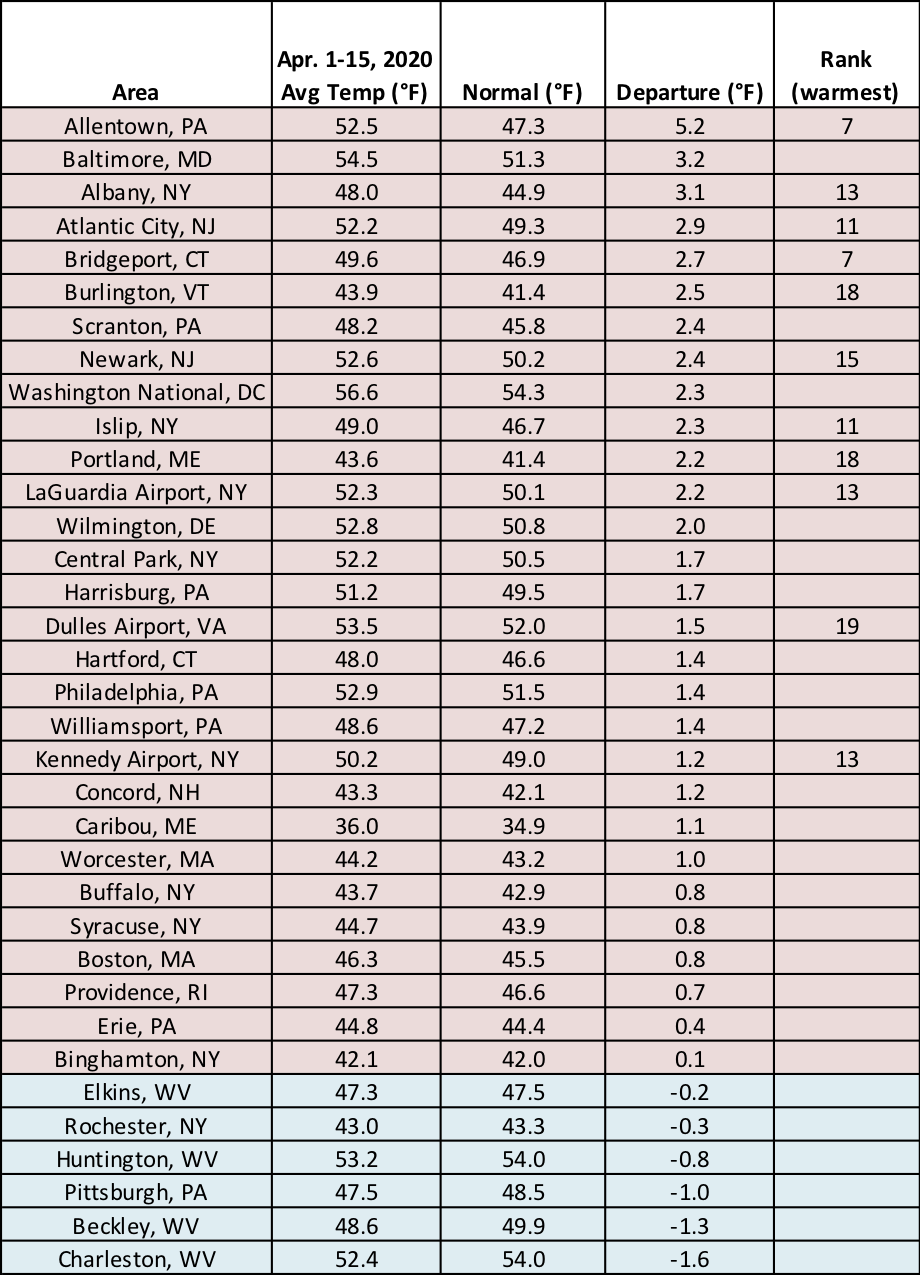
Eleven major climate sites ranked this first half of April among their 20 warmest.
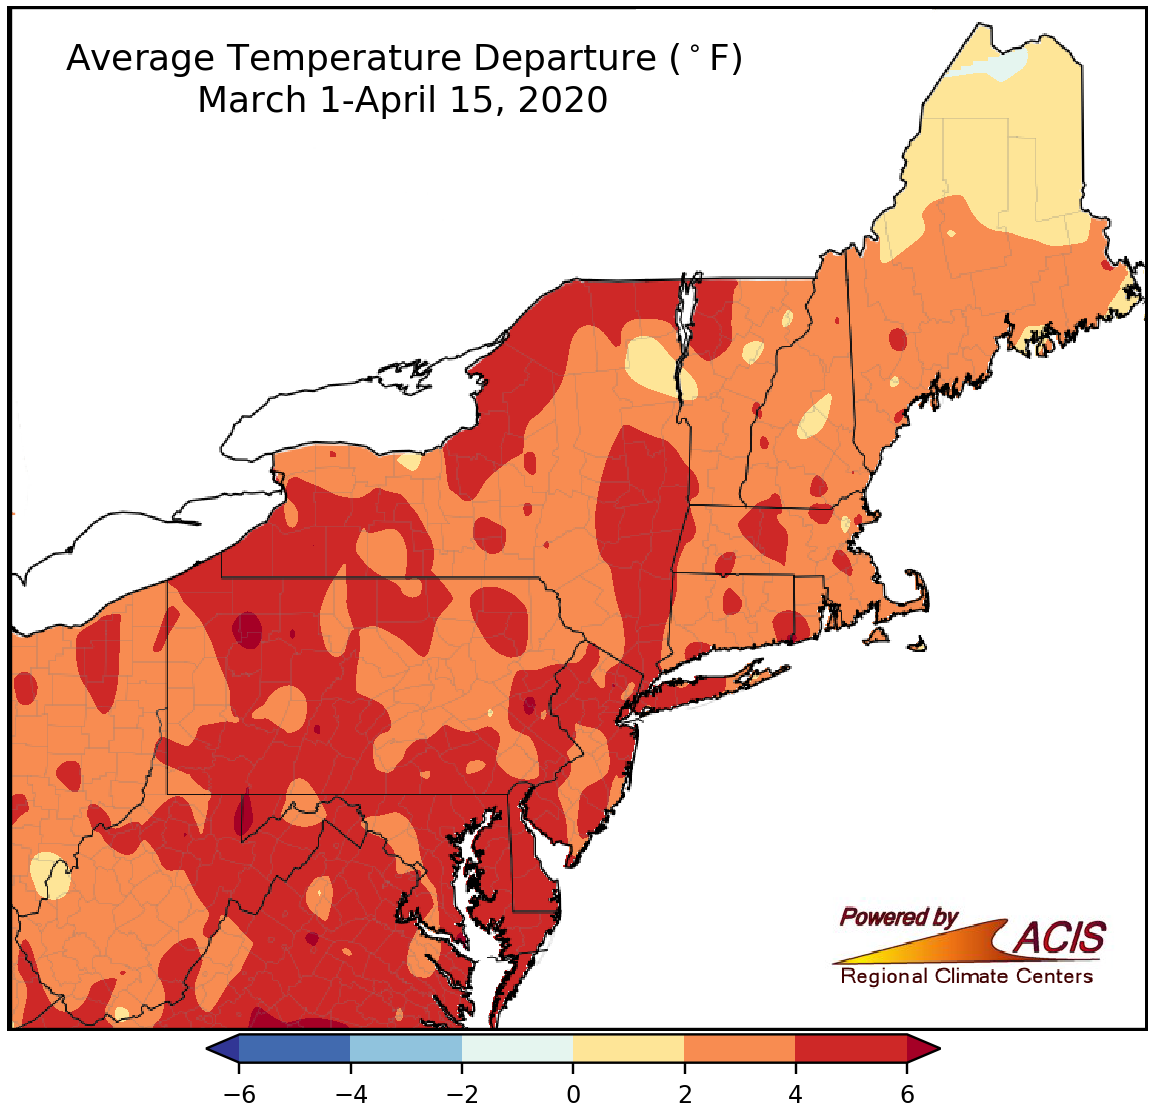
March 1-April 15 average temperatures ranged from near normal to 6°F above normal.
For the first half of spring, average temperatures were near- to above-normal for the entire Northeast, with many areas 2°F to 6°F warmer than normal. All but one of the major climate sites ranked this first half of spring among their 20 warmest on record, with departures ranging from 1.3°F above normal in Caribou, ME, to 6.9°F above normal in Allentown, PA.
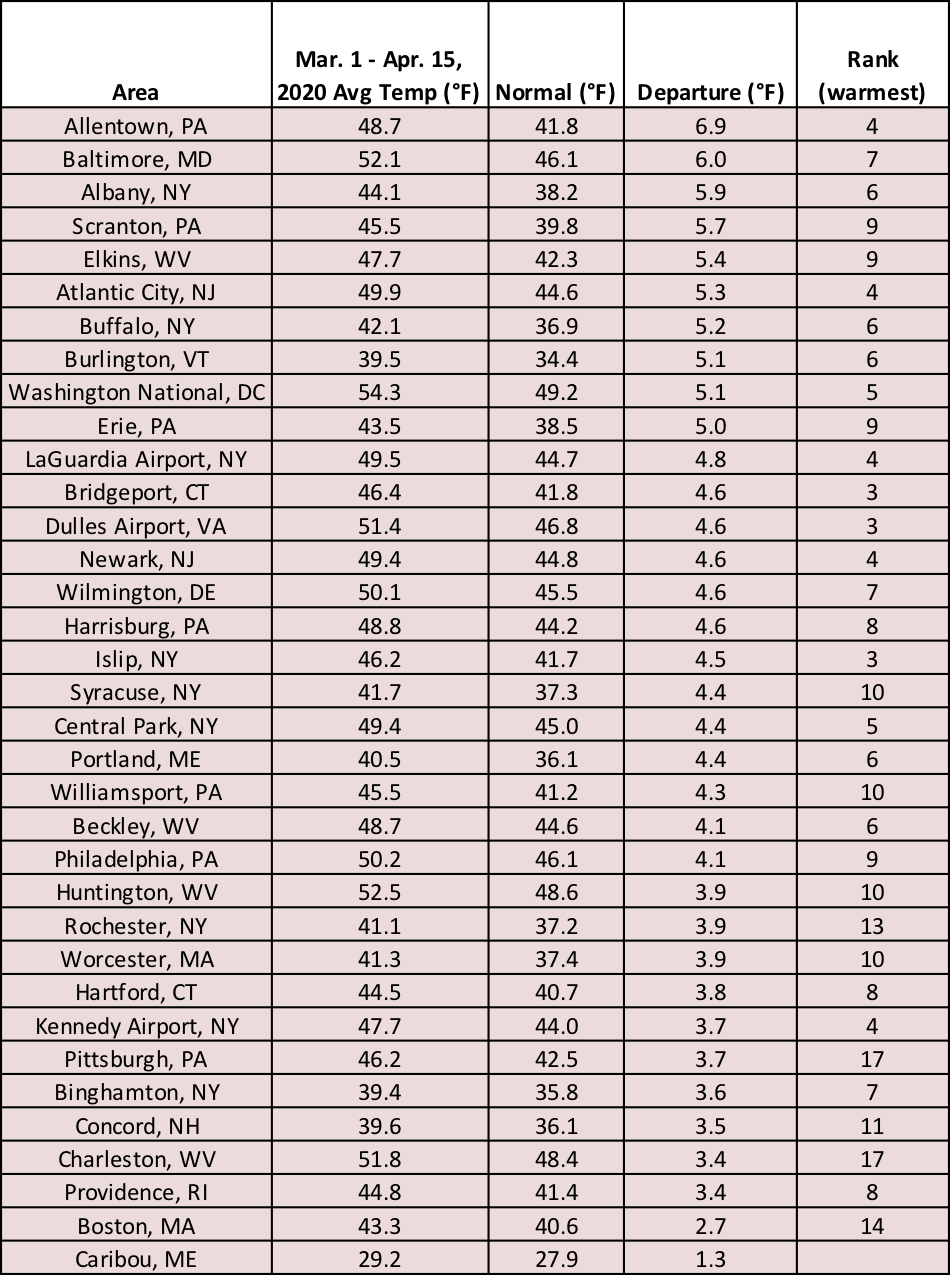
This March 1-April 15 period ranked among the 20 warmest at 34 major climate sites.
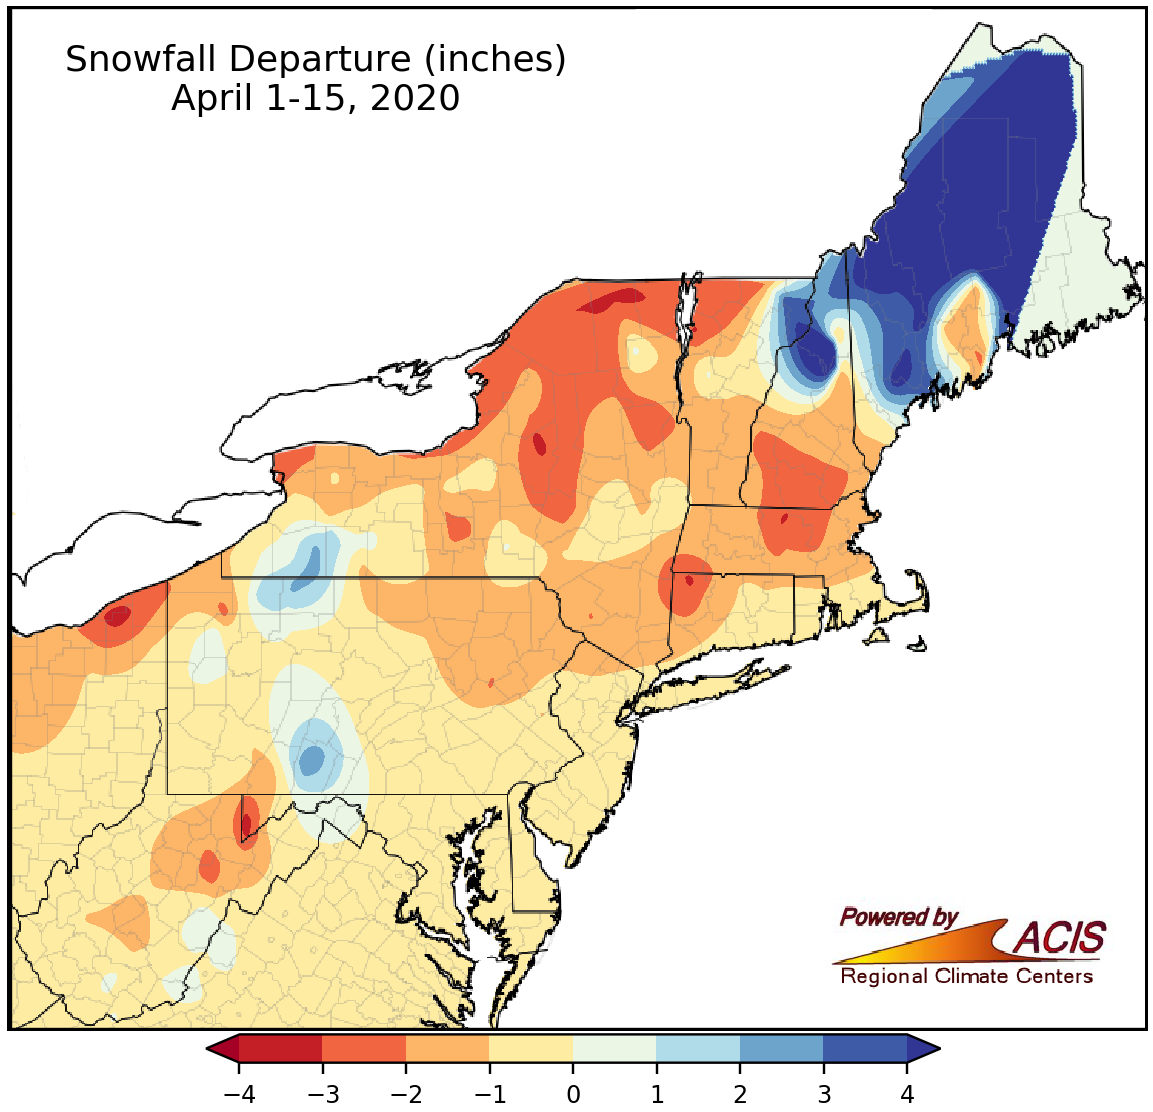
Snowfall ranged from 3 inches below normal to more than 4 inches above normal from April 1-15.
A majority of the Northeast had a snowfall deficit during the first two weeks of April, with the largest departures exceeding 4 inches. However, there were a few locations that saw more snowfall than usual, particularly Maine and northern New Hampshire. Snowfall was near to below normal at most of the 35 major climate sites but ranged from 3.1 inches below normal in Burlington, VT, and Elkins, WV, to 8.7 inches above normal in Caribou, ME, its sixth snowiest start to April.
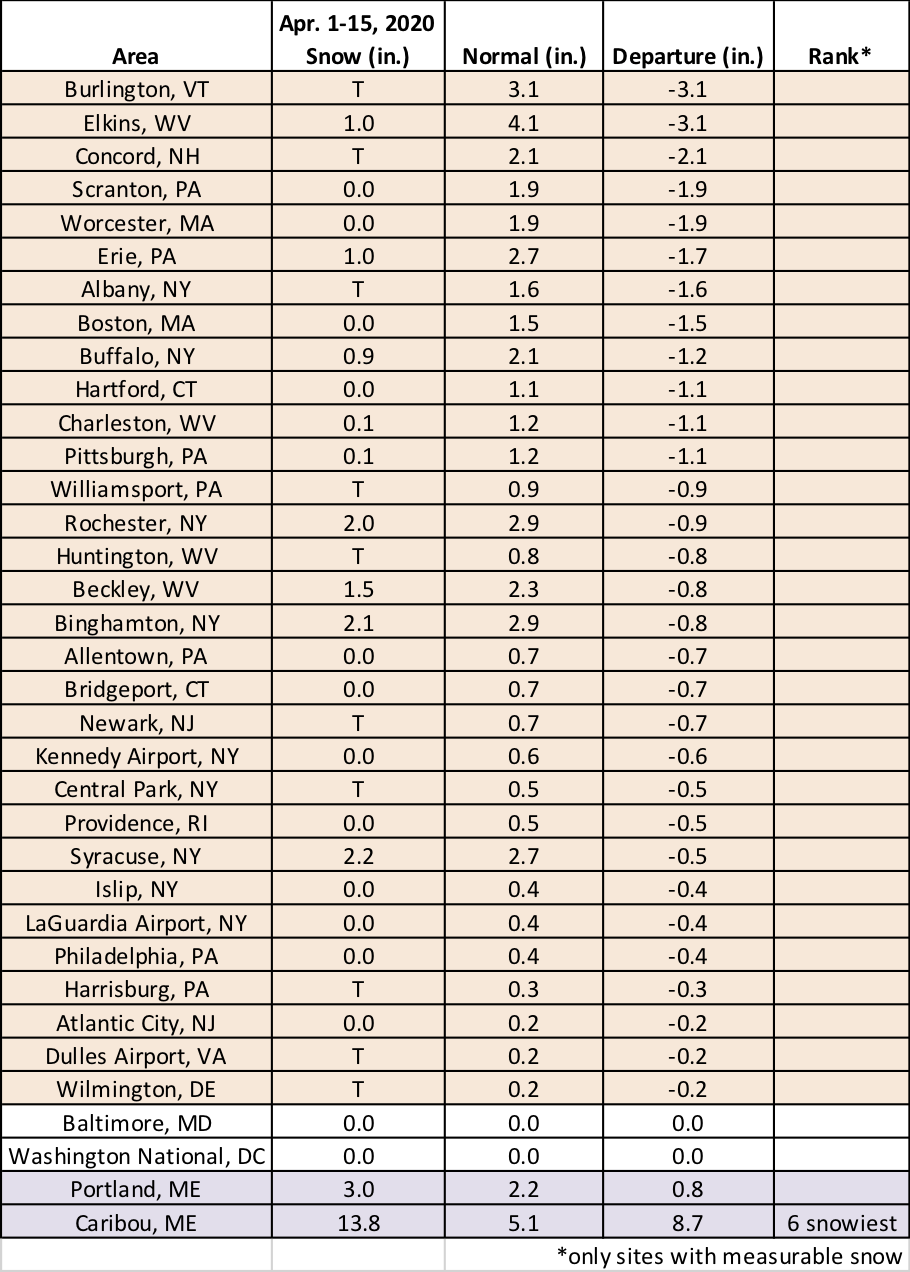
Most major climate sites received normal or below-normal snowfall during the first half of April but Caribou had its sixth snowiest start to the month.
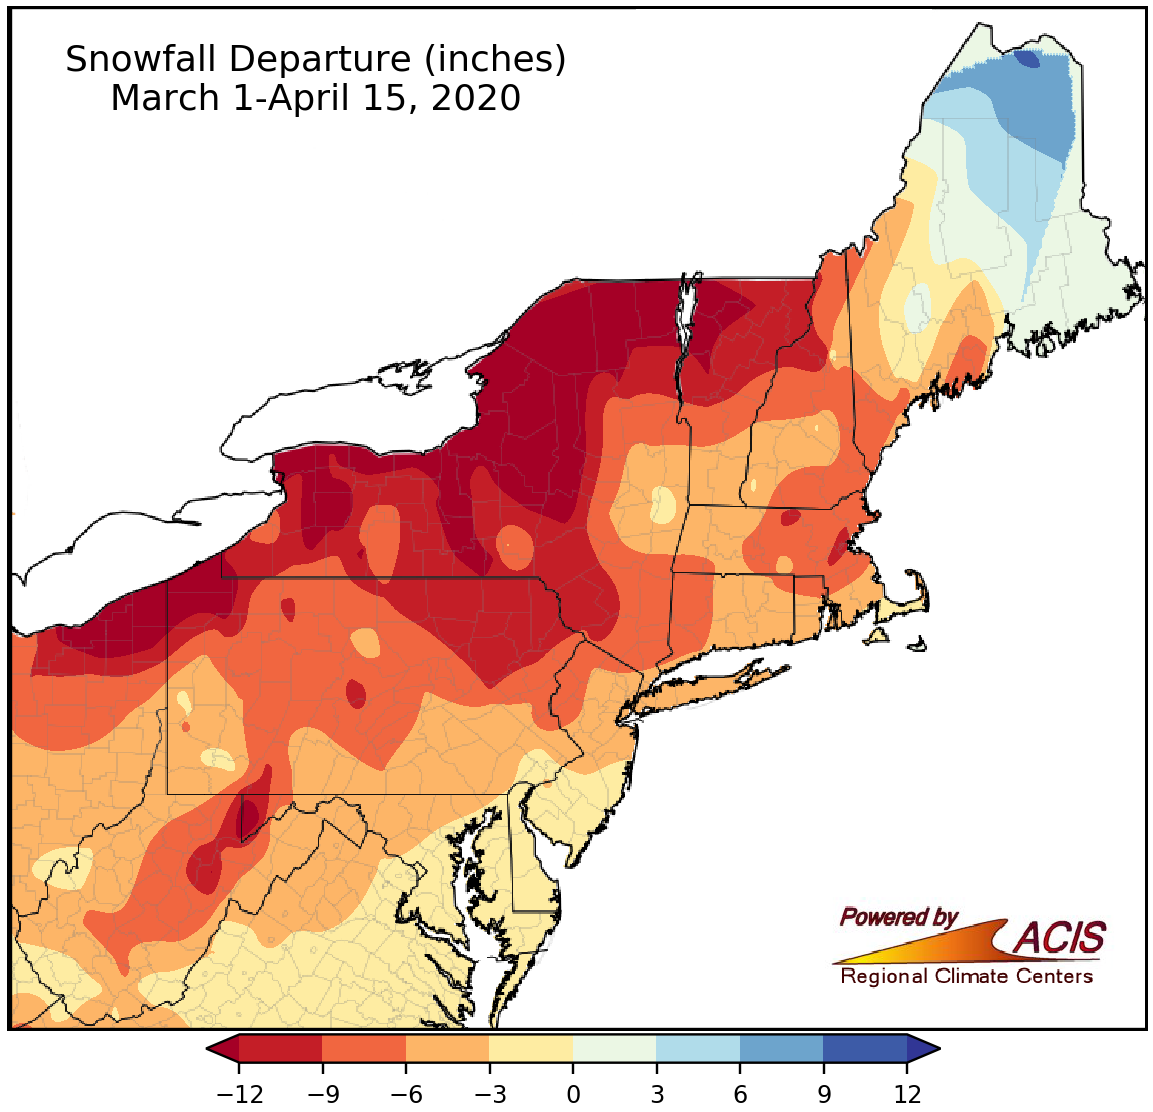
During the first half of spring, snowfall ranged from more than 12 inches below normal to near normal for most of the Northeast.
A majority of the Northeast saw below-normal snowfall during the first half of spring, with the largest deficits of over 12 inches in northwestern Vermont, New York, northwestern Pennsylvania, and western Maryland. The lone exception was northern/eastern Maine, which saw a snow surplus of up to 9 inches. Nine major climate sites had their least snowy March 1-April 15 period on record and another 16 of the sites ranked this March 1-April 15 period among their 20 least snowy. Departures ranged from 15.4 inches below normal in Erie, PA, to 1.3 inches below normal in Washington, D.C., and Atlantic City, NJ. In fact, Caribou was the only major climate site to receive more snow than usual, seeing a surplus of 9.1 inches. The site also recorded its second greatest number of consecutive days with at least 1 inch of snow on the ground. As of April 15, the streak was at 156 days (starting November 12, 2019). The record was set just last year at 163 days.
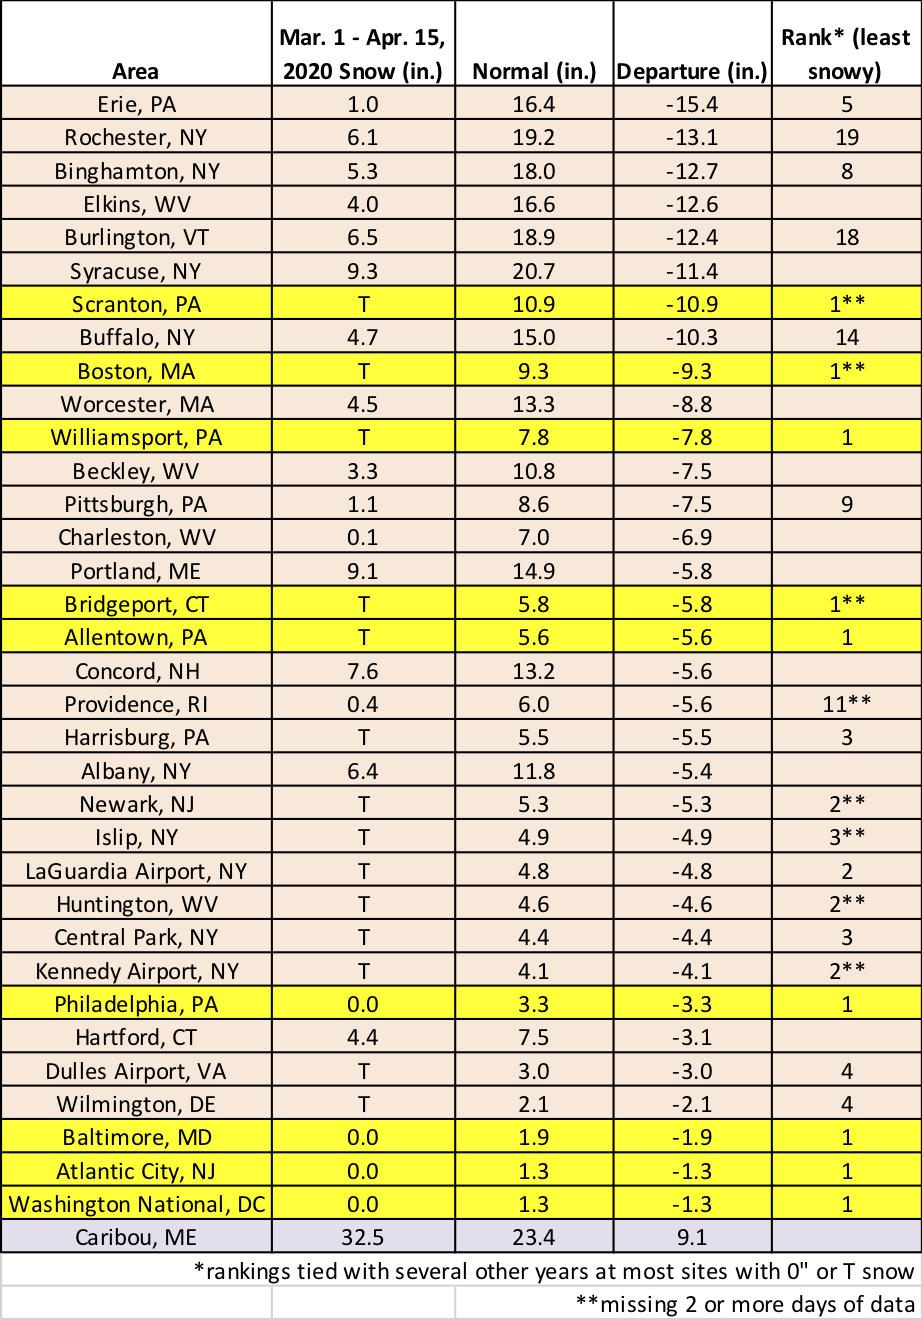
Nine major climate sites had their least snowy March 1-April 15 period on record.
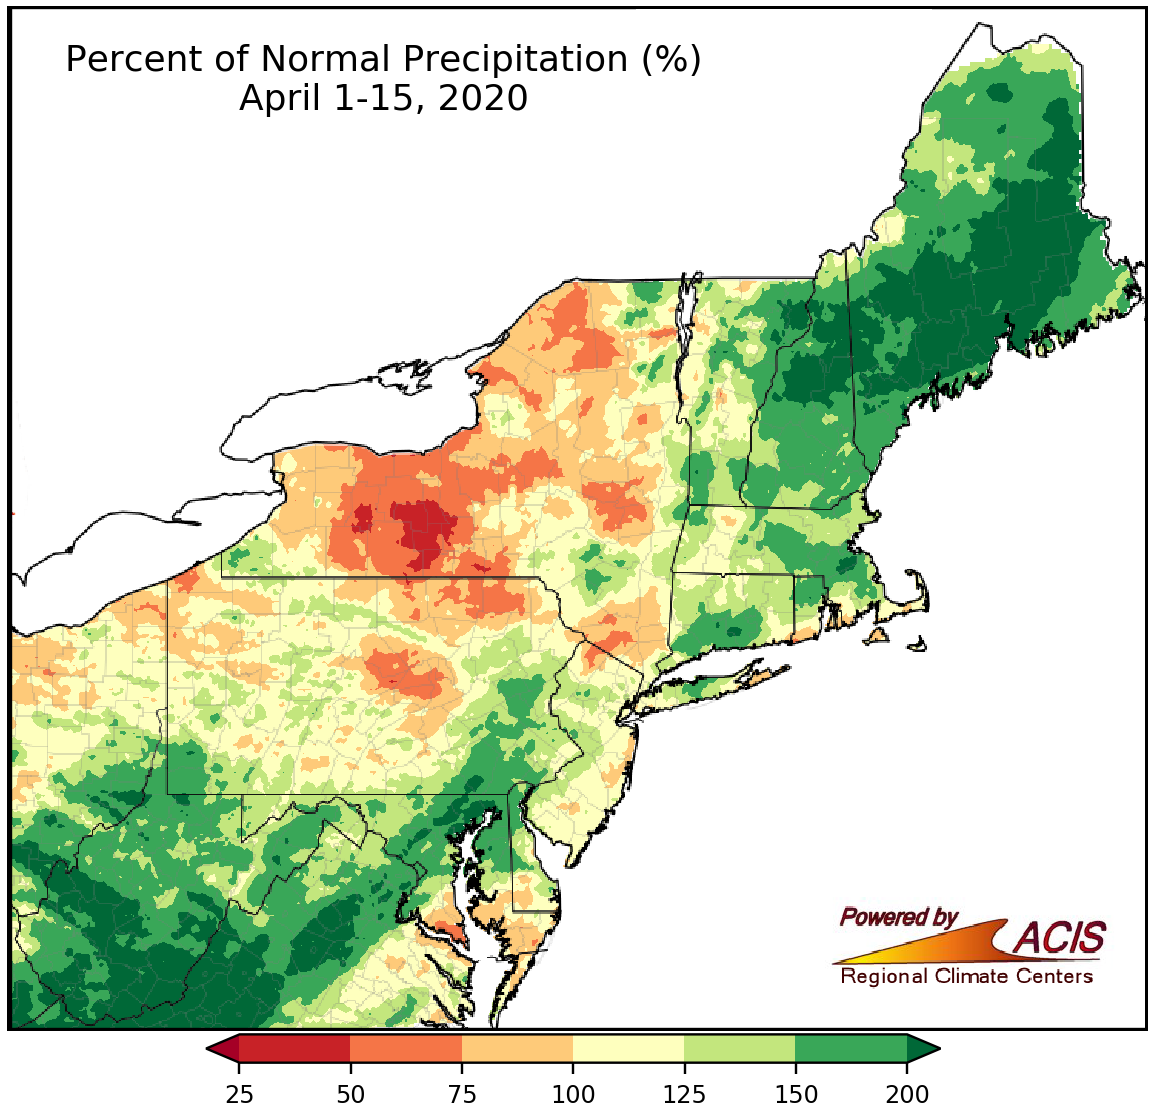
Precipitation during the first two weeks of April ranged from 25% of normal to more than 200% of normal.
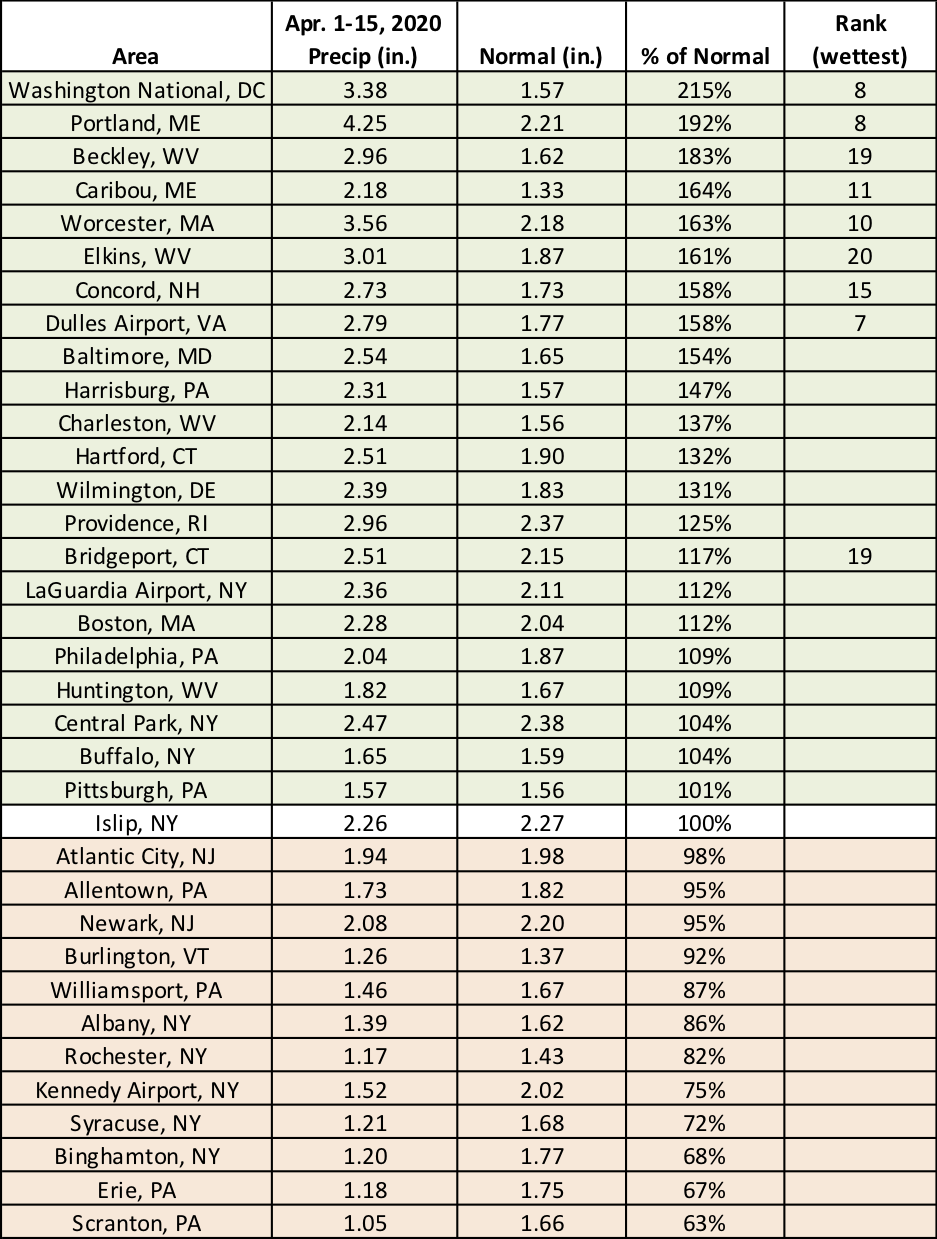
From April 1-15, precipitation ranged from 25% of normal in central New York to more than 200% of normal in parts of northern New England, Maryland, and West Virginia. A large portion of the region was on the wet side of normal for the time period. Of the 35 major climate sites, 22 were wetter than normal, with nine of those sites ranking this April 1-15 period among their 20 wettest on record. Precipitation at all the major climate sites ranged from 63% of normal in Scranton, PA, to 215% of normal in Washington, D.C.
Nine major climate sites had one of their 20 wettest starts to April.
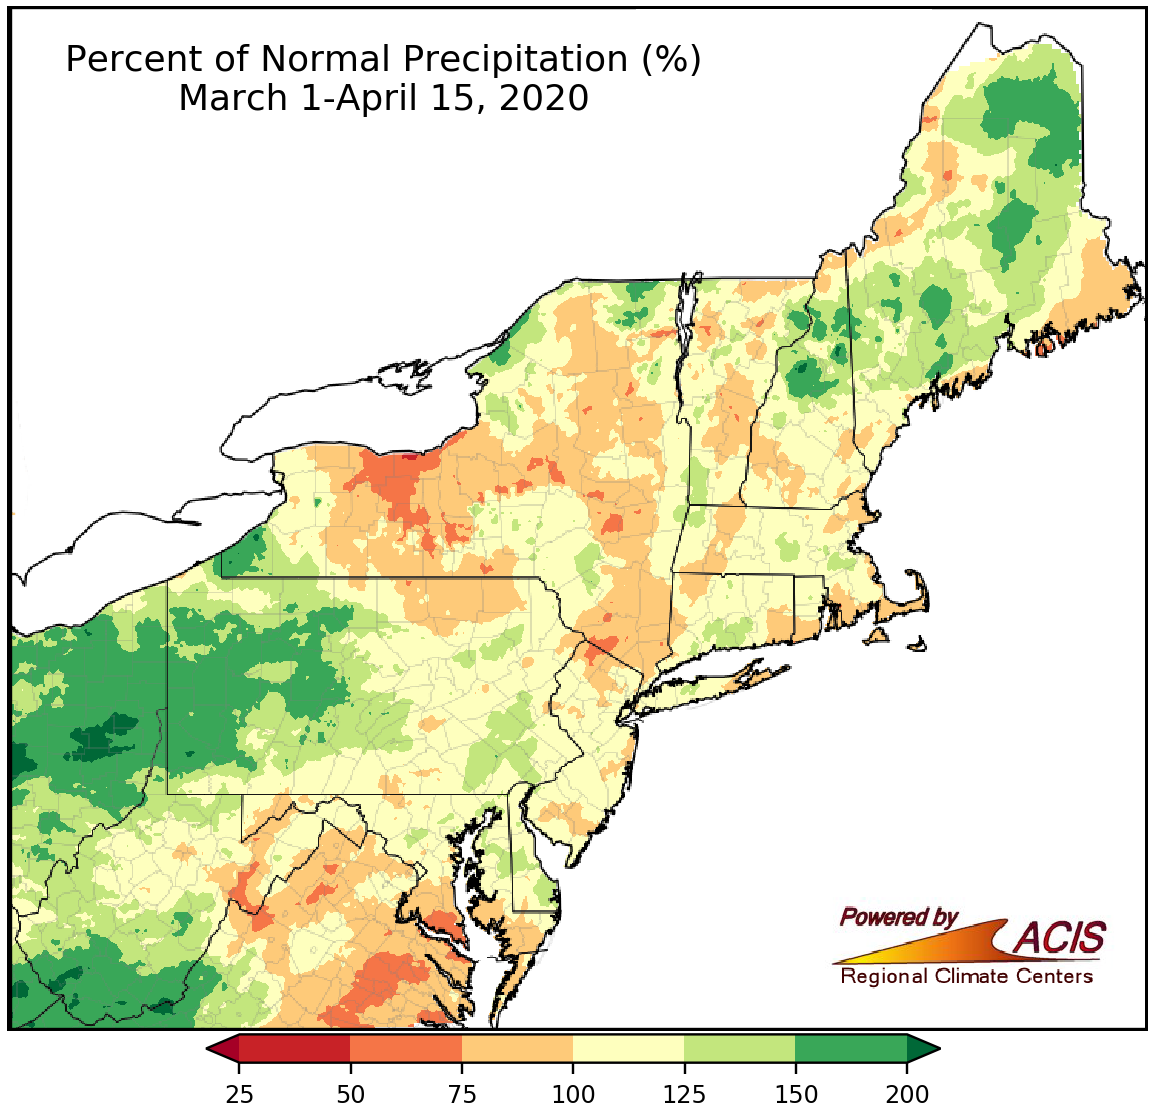
March 1-April 15 precipitation ranged from 50% of normal to 200% of normal.
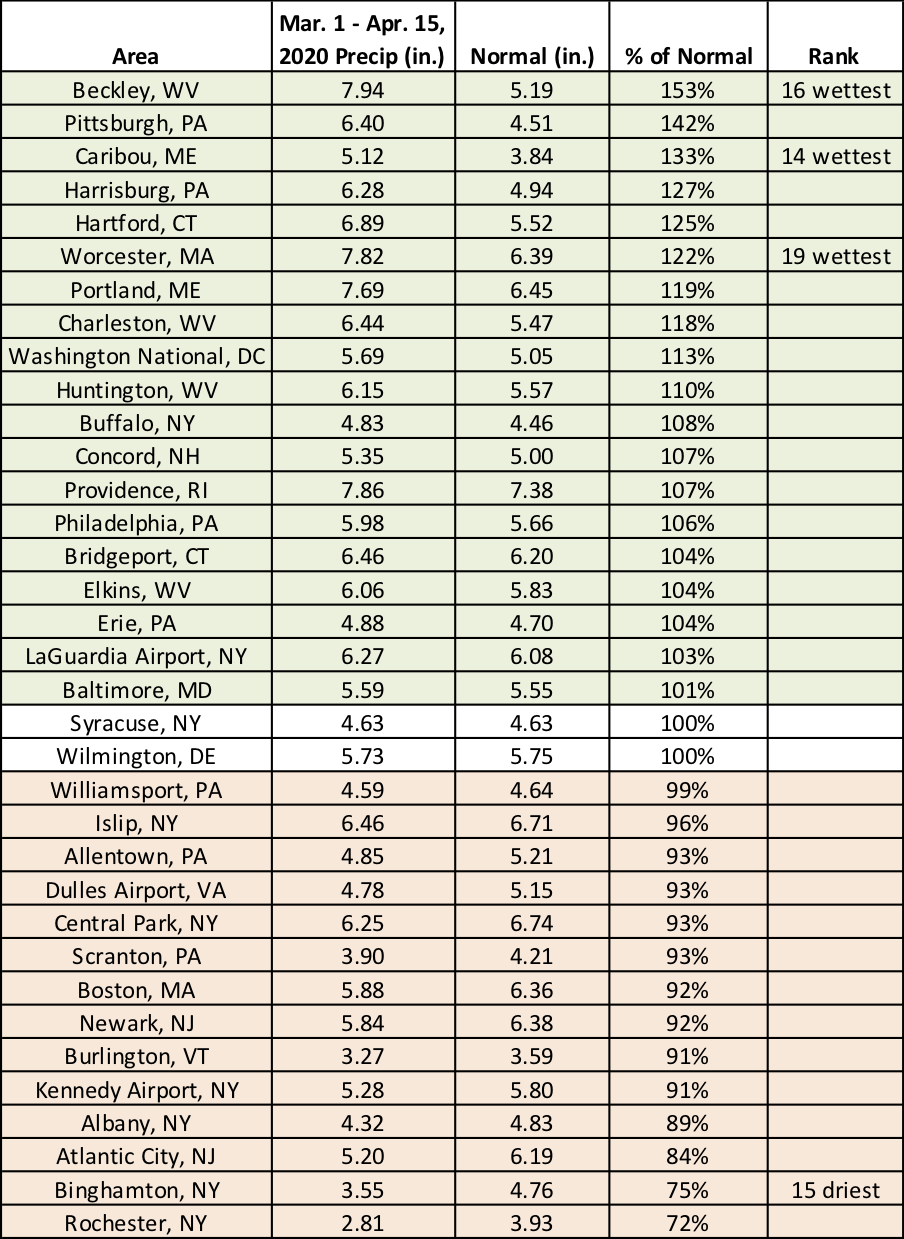
During the first half of spring, precipitation ranged from 50% of normal to 200% of normal. The driest areas tended to be in central New York, while the wettest areas tended to be in southern West Virginia, western Pennsylvania, and parts of northern New England. March 1-April 15 precipitation at the major climate sites ranged from 72% of normal in Rochester, NY, to 153% of normal in Beckley, WV. In all, 19 of the sites saw above-normal precipitation during the period, with three sites ranking this first half of spring among their 20 wettest. On the other end of the spectrum, 14 of the major climate sites were drier than normal, with Binghamton, NY, having its 15th driest first half of spring.
This first half of spring ranked among the 20 driest for three sites and among the 20 wettest at one site.
For May, NOAA’s Climate Prediction Center favors above-normal temperatures for areas closer to the Atlantic coast and equal chances of below-, near-, or above-normal temperatures for the rest of the region. There’s a tilt towards wetter-than-normal conditions for southern West Virginia, with equal chances predicted for the rest of the Northeast.
May is expected to average out to be warmer than normal in areas shaded orange.
Southern West Virginia could be wetter than normal once again in May.