Ice Cold Start to January and Winter
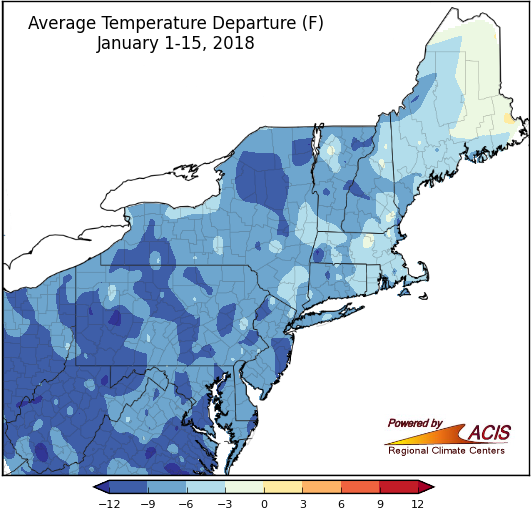
January 1-15 average temperatures ranged from more than 12°F below normal to near normal.
During the first half of January, average temperatures ranged from 3°F to 9°F below normal for a majority of the Northeast. All 35 major climate sites experienced below-normal temperatures, with 26 of them ranking this first half of January among their 20 coldest. There was a brief break from the cold from January 11-13 when highs soared into the 50s, 60s, and 70s and several sites set daily maximum temperature records.
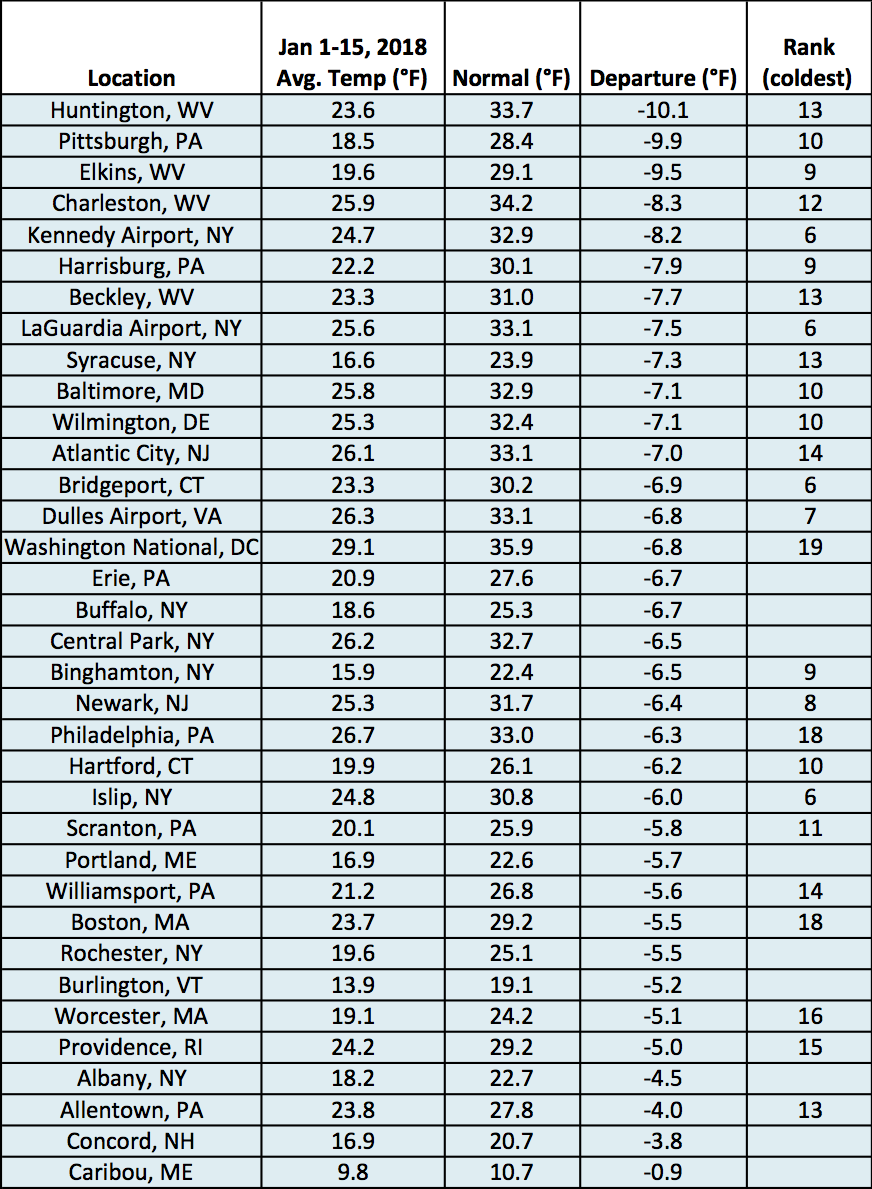
Average temperature departures for January 1-15 at the major climate sites ranged from 10.1°F below normal in Huntington, WV, to 0.9°F below normal in Caribou, ME.
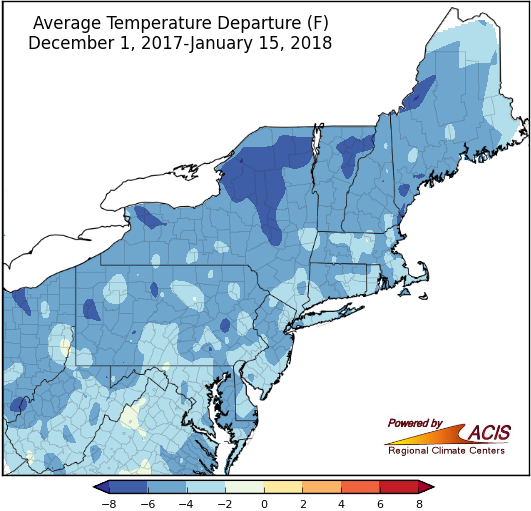
The first half of winter (December 1-January 15) was also colder than normal.
With both December and the first half of January on the cold side of normal, average temperatures for the first half of winter ranged from 2°F to 8°F below normal. The coldest areas were found in parts of Pennsylvania, New York, and northern New England. All 35 major climate sites were colder than normal, with 19 of them ranking this first half of winter among their 20 coldest.
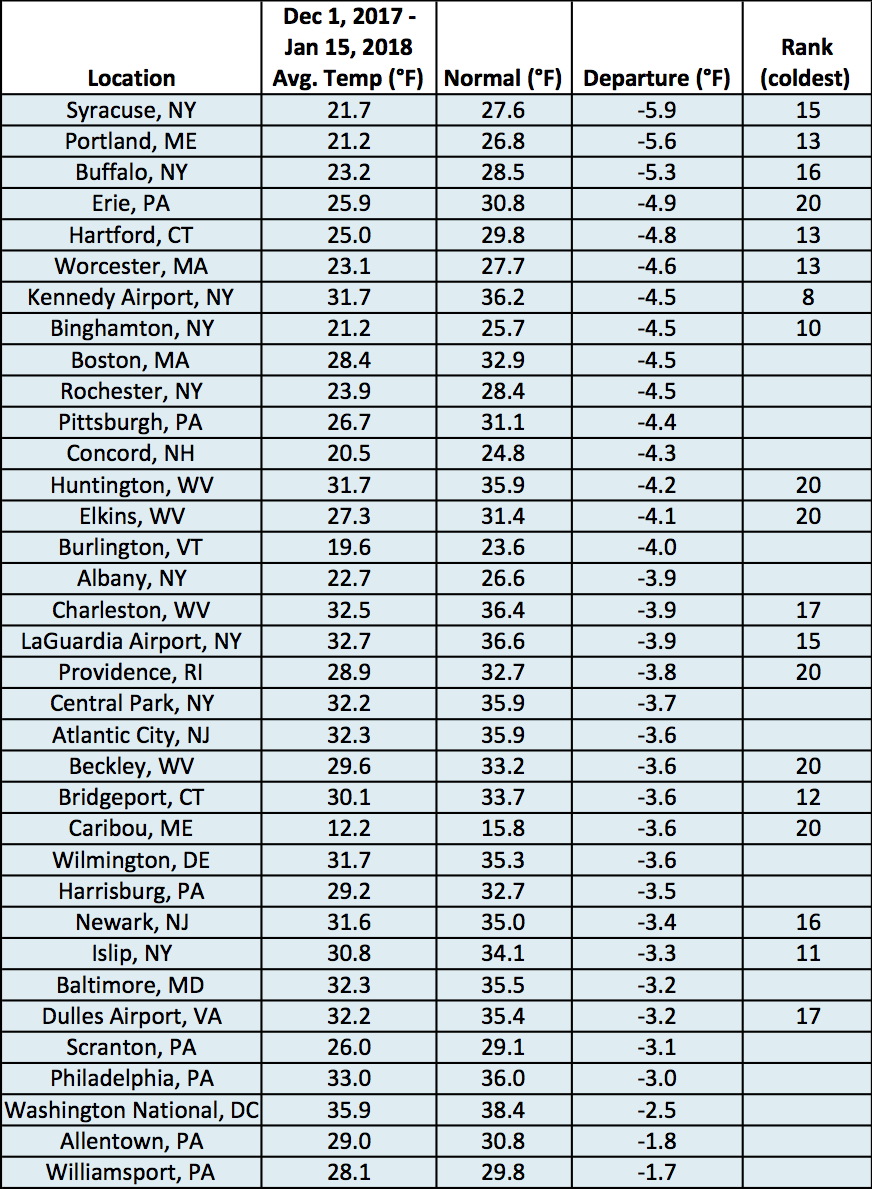
Average temperature departures for December 1-January 15 at the major climate sites ranged from 5.9°F below normal in Syracuse, NY, to 1.7°F below normal in Williamsport, PA.
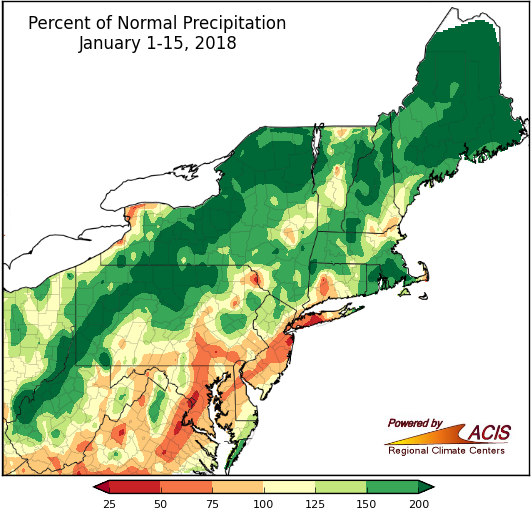
Many areas received above-normal precipitation during the first half of January.
Precipitation during the first two weeks of January ranged from 25% of normal to more than 200% of normal. The driest spots tended to be around the New York City and Washington, D.C.-Baltimore metro areas. Ten major climate sites were drier than normal, with Kennedy Airport, NY, having its 19th driest start to January. Drought and abnormally dry conditions lingered in some of these spots. On the other hand, there were numerous spots that saw more than 200% of normal precipitation. Ten of the 25 wetter-than-normal major climate sites ranked this first half of January among their 20 wettest. In fact, Caribou, ME, had its wettest start to January.
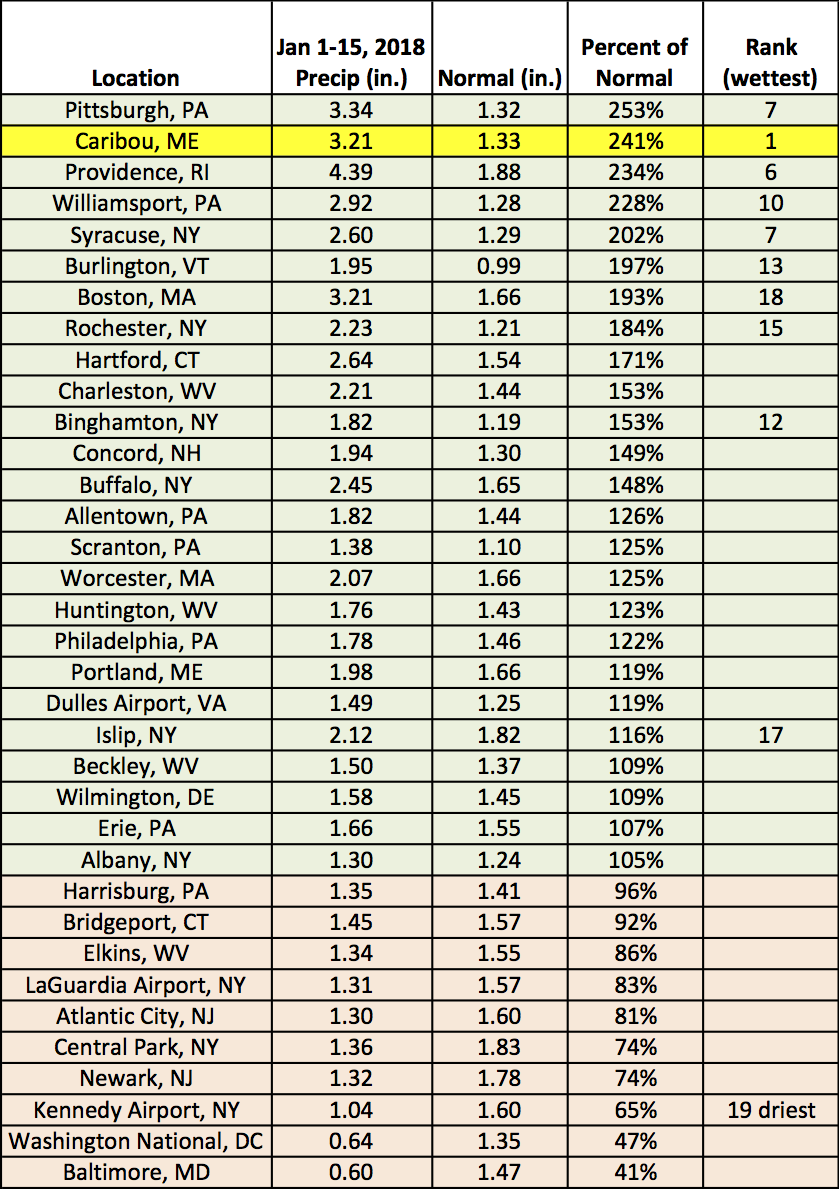
January 1-15 precipitation at the major climate sites ranged from 41% of normal in Baltimore, MD, to 253% of normal in Pittsburgh, PA. Caribou, ME, had a record-wet start to January.
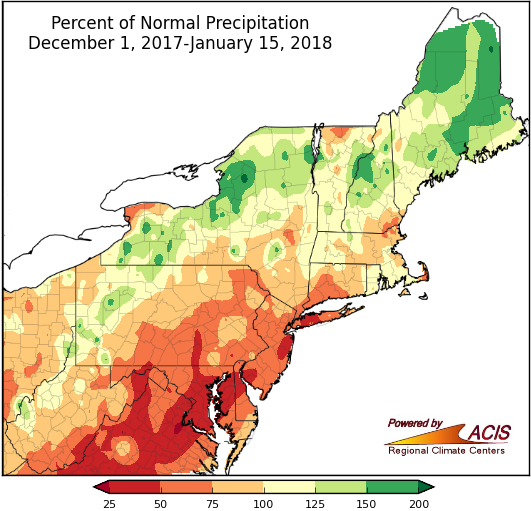
Precipitation during the first half of winter varied, ranging from 25% of normal to 200% of normal.
December was generally drier than normal and January was generally wetter than normal, so precipitation during the first half of winter ranged from 25% of normal in southeastern parts of the region to 200% of normal in northern parts of the region. Twenty-five of the major climate sites were drier than normal, with 11 of those ranking this first half of winter among their 20 driest. Two of the ten wetter-than-normal sites ranked this first half of January among their 20 wettest.
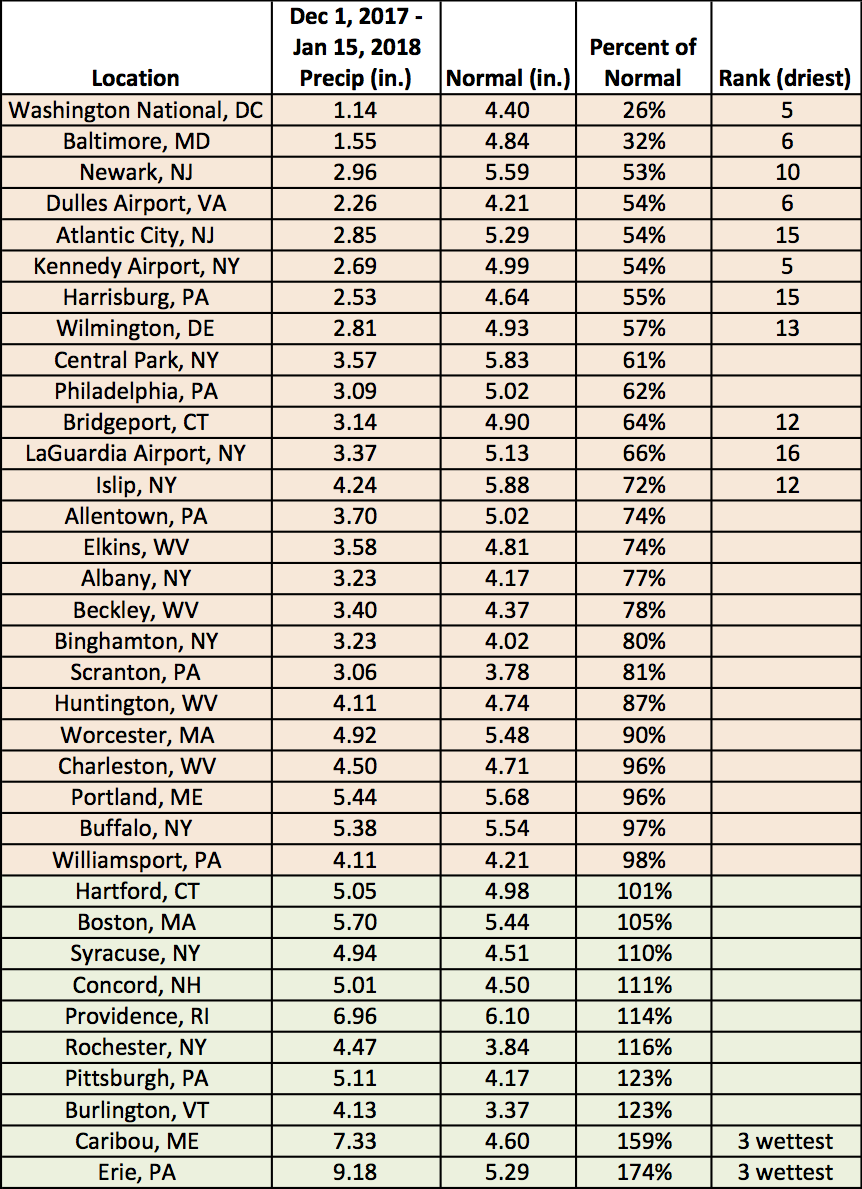
December 1-January 15 precipitation at the major climate sites ranged from 26% of normal in Washington National, DC, to 174% of normal in Erie, PA.
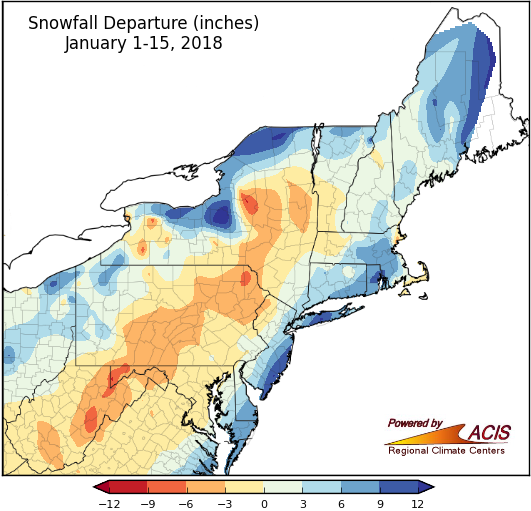
January 1-15 snowfall ranged from 9 inches below normal to more than 12 inches above normal.
Snowfall during the first two weeks of January ranged from 9 inches below normal to more than 12 inches above normal. The largest deficits were in parts of eastern West Virginia, western Maryland, northeastern Pennsylvania, and a few spots in northern New York. The largest surpluses were generally southeast of Lake Ontario and in eastern Maine. Of the 13 major climate sites that saw below-normal snowfall, Dulles Airport, VA, had its 19th least snowy start to January. Of the 22 major climate sites that were snowier than normal, 16 ranked this first half of January among their 20 snowiest.
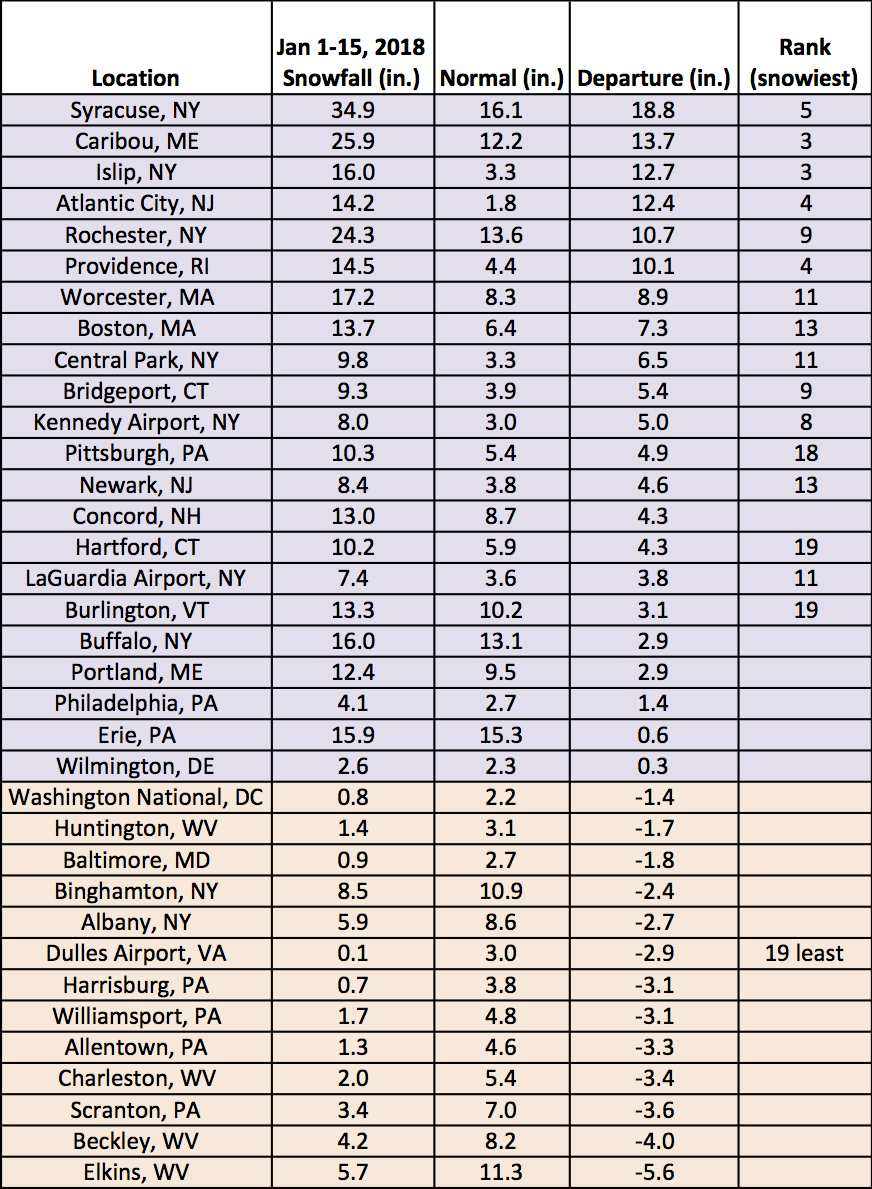
January 1-15 snowfall at the major climate sites ranged from 5.6 inches below normal in Elkins, WV, to 18.8 inches above normal in Syracuse, NY.
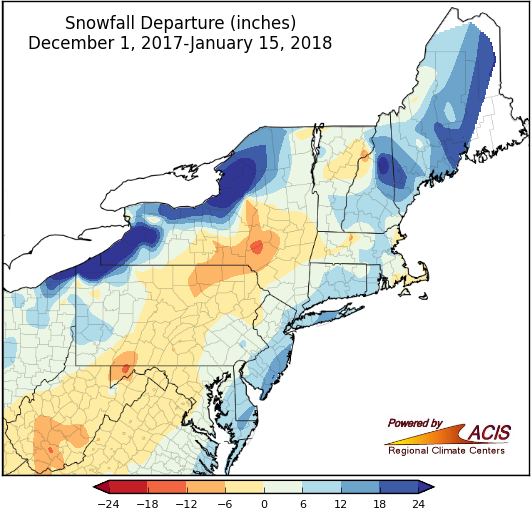
December 1-January 15 snowfall ranged from 12 inches below normal to more than 24 inches above normal.
With variable snowfall in December and January, snowfall during the first half of winter generally ranged from 12 inches below normal to more than 24 inches above normal. Southern West Virginia, western Maryland, parts of south-central and northeast Pennsylvania, and central New York tended to have the largest deficits, while lake-effect prone areas near Lakes Erie and Ontario tended to have the largest surpluses. Of the twelve major climate sites that received below-normal snowfall, Binghamton, NY, had its 16th least snowy start to winter. Twenty-three major climate sites were snowier than normal, with 17 sites ranking it among their 20 snowiest.
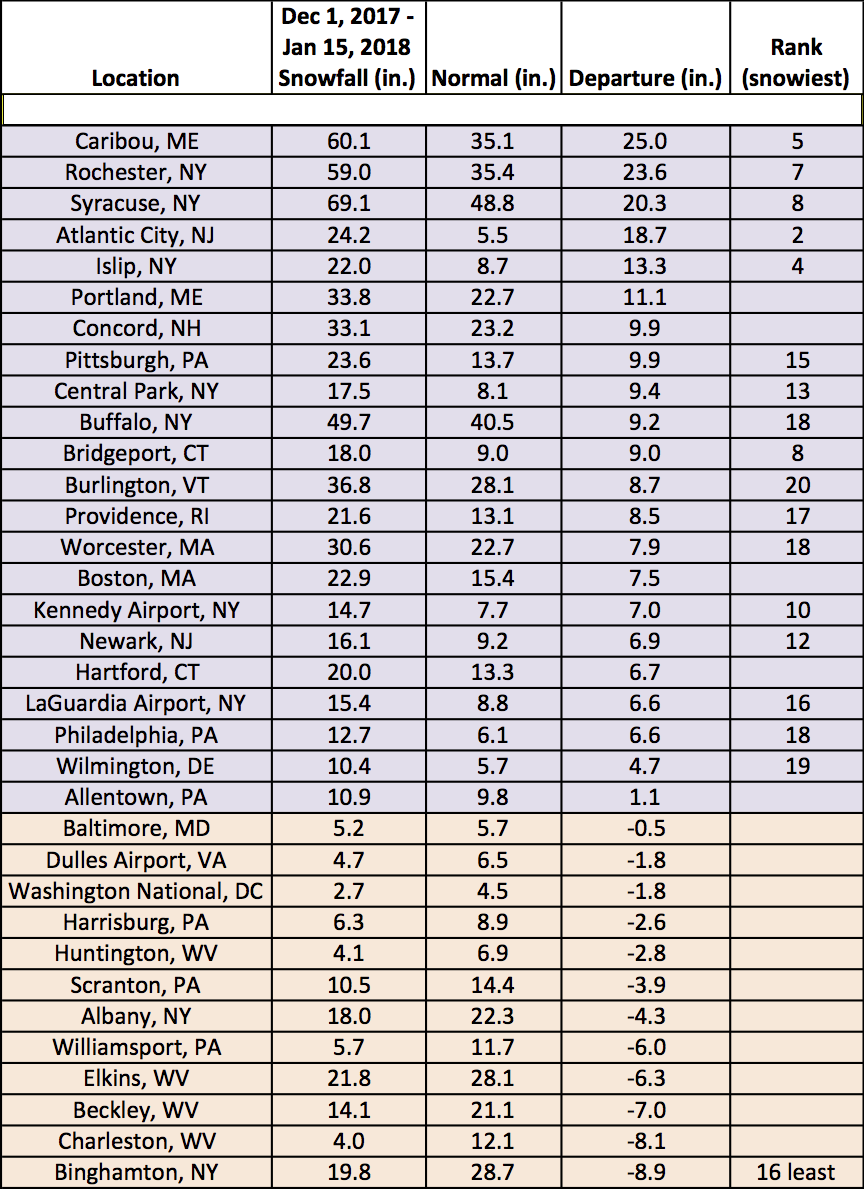
Snowfall for December 1-January 15 at the major climate sites ranged from 8.9 inches below normal in Binghamton, NY, to 25 inches above normal in Caribou, ME.