Updated Climate Normals Show Warmer, Snowier Spring
Climate normals are three-decade averages of climatological variables such as temperature and precipitation. These normals represent average climate conditions at a location (for instance, low temperatures in January at Central Park, NY, are typically between 27°F and 30°F) and serve as a baseline to show how current (and predicted) conditions compare to those average conditions (a low of 40°F in January at Central Park is above normal). NOAA updates climate normals every decade as mandated by the World Meteorological Organization. In early May, the normals were updated to reflect the most recent 30-year period of 1991–2020. The previous normals period ran from 1981–2010.
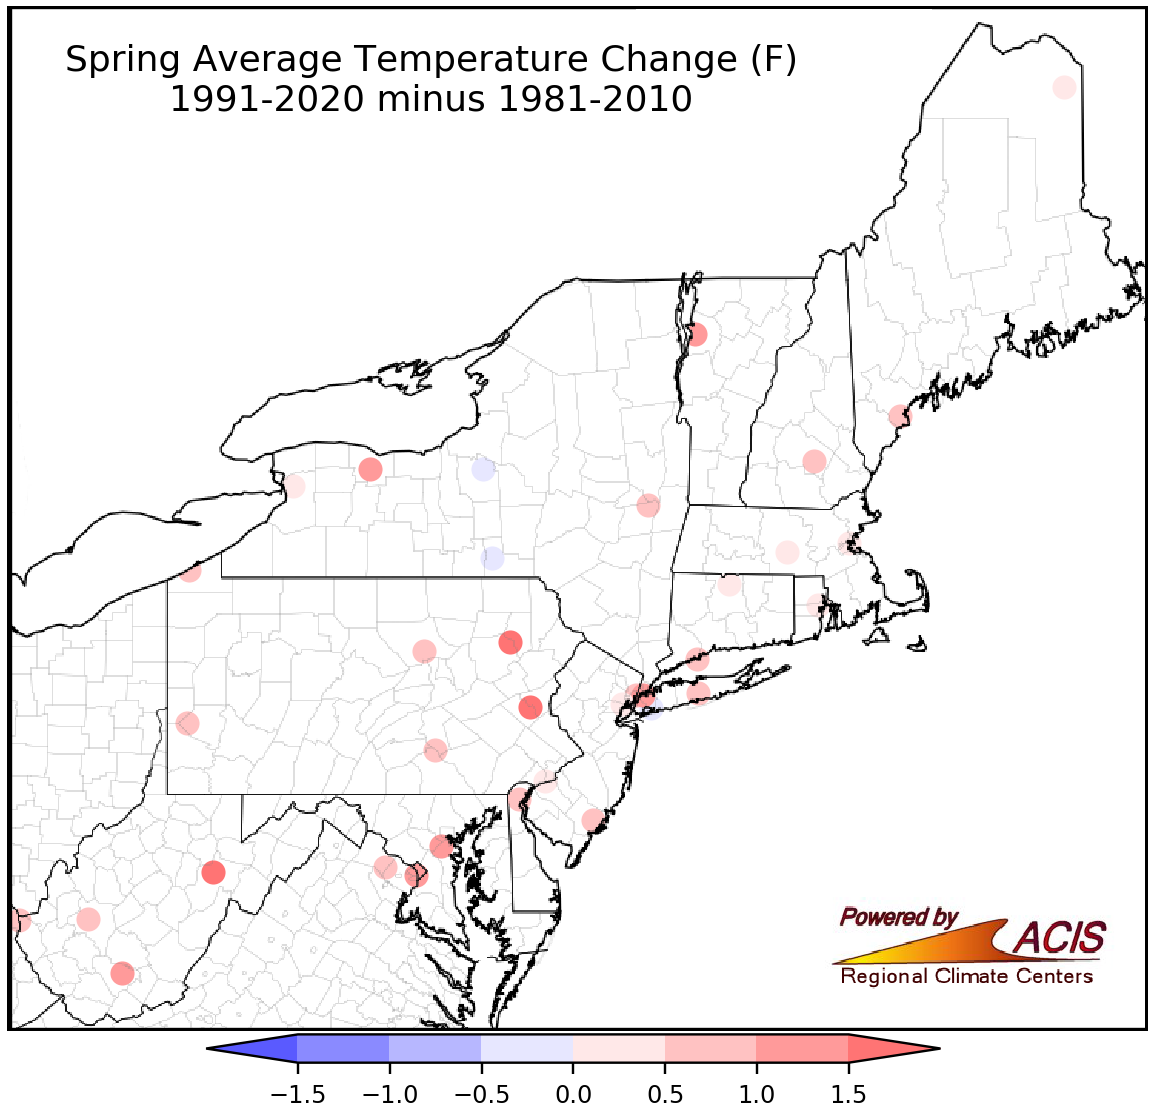
Comparing the 1991-2020 normals to 1981-2010 normals, most of the Northeast saw their spring average temperature increase.
The 1991-2020 normals show that “normal” is now warmer for most of the U.S., due in large part to climate change. In the Northeast, the normal average temperature for spring got warmer at 32 of the 35 major climate sites. Allentown, PA, saw the largest jump, warming by 1.9°F. Of course, the amount of warming varies by location, and may not show up during every single month or season. Such was the case at Kennedy Airport, NY, which saw a slight decrease of 0.4°F to its spring average temperature normal. Despite that dip, the long-term trend shows that spring has gotten warmer at the airport since 1949.
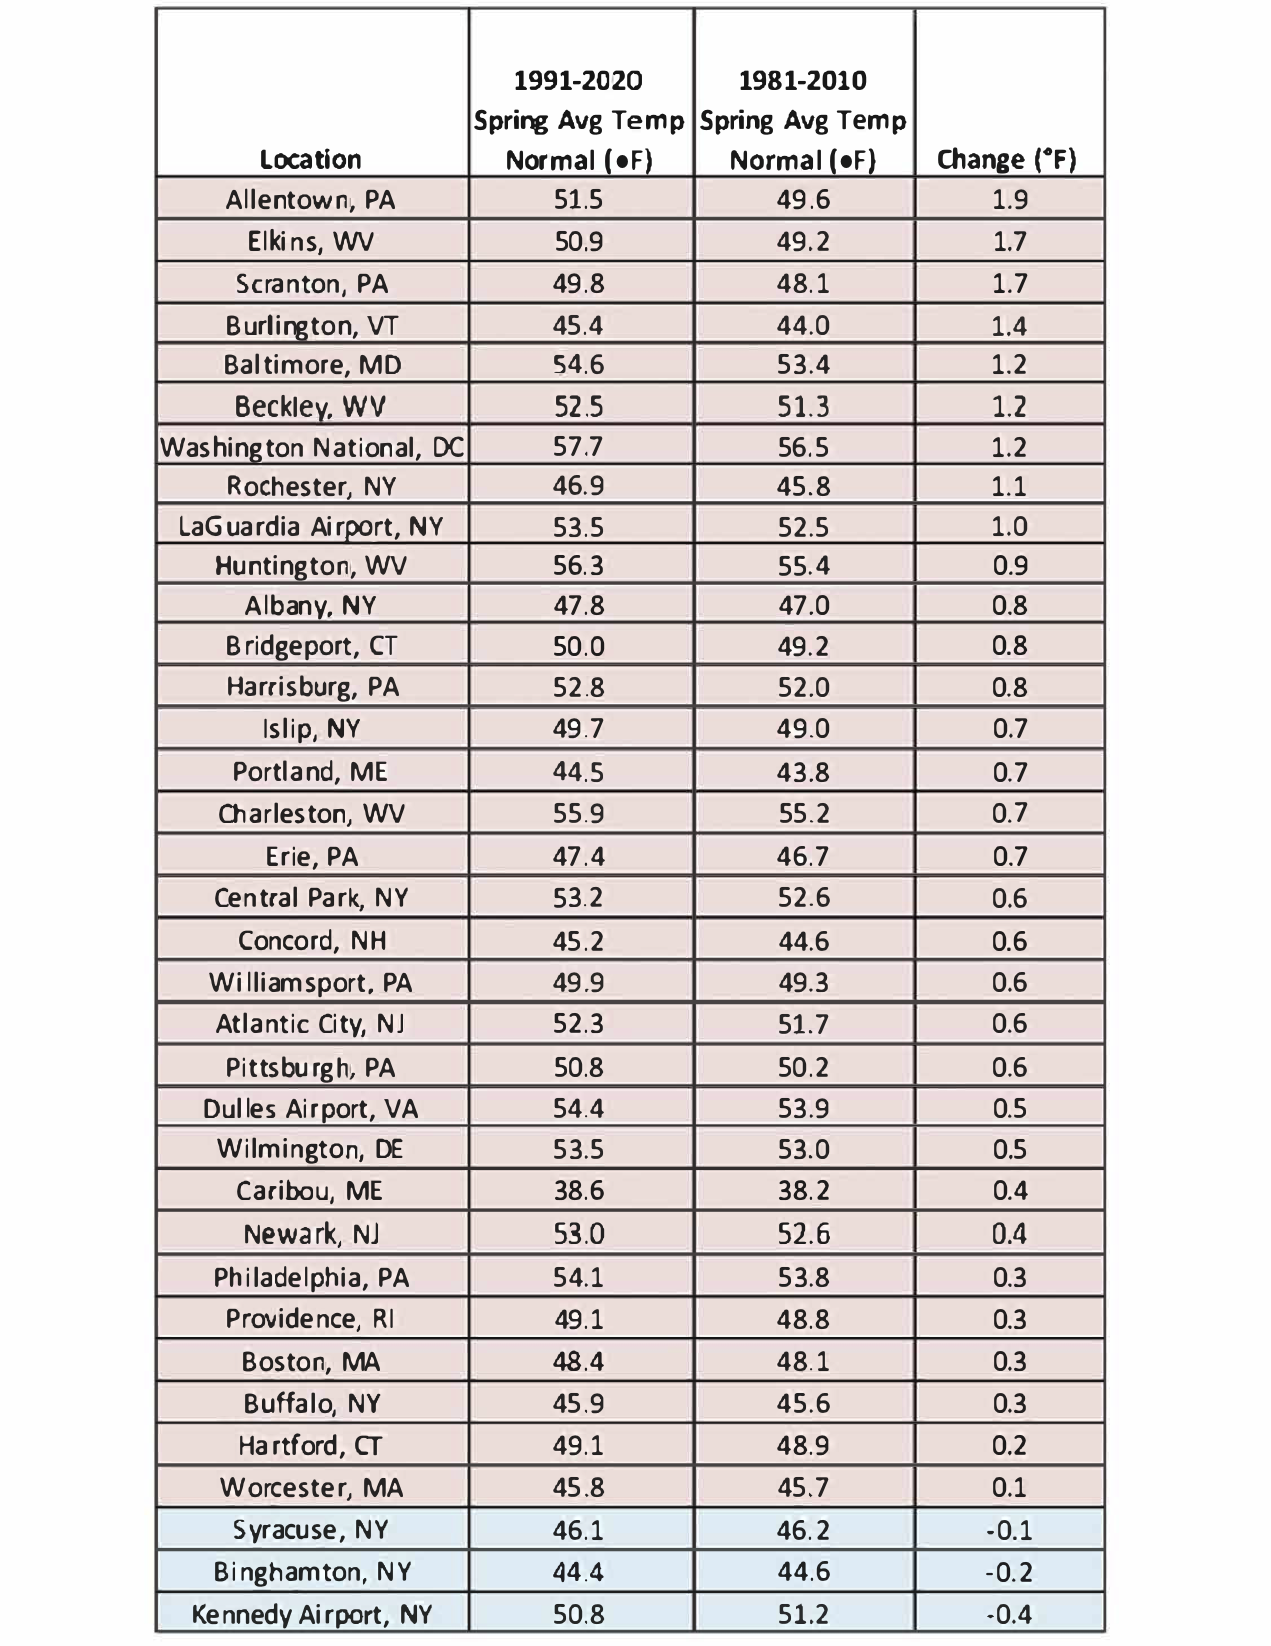
A comparison of spring average temperature normals. Spring has warmed by as much as 1.9°F at the 35 major climate sites.
Another interesting aspect of having warmer normals is that we may not see as many above-normal days. Let’s say the normal high temperature on May 1 was 70°F (based on 1981-2010) but now it’s 74°F (based on 1991-2020). If the actual high temperature on May 1, 2021, reached 72°F, based on the old normals it would have been 2°F warmer than normal but now based on the updated normals it is 2°F colder than normal! The actual high temperature didn’t change but the baseline for comparison got warmer. Those above-normal days of the past have now become “normal.”
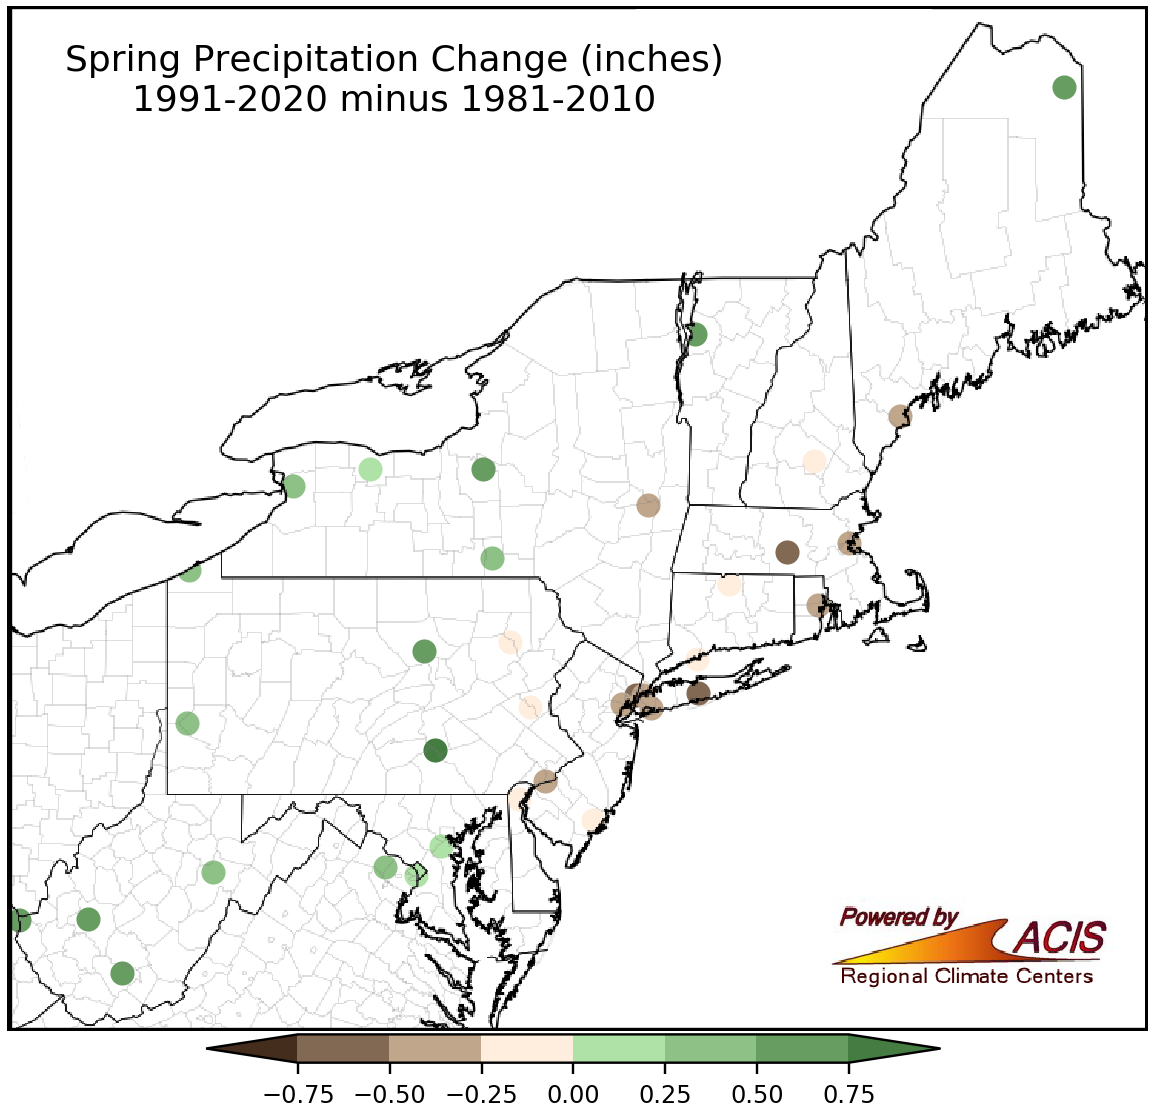
Coastal areas saw a decrease in their normal spring precipitation while interior areas saw an increase.
For the U.S., the 1991-2020 annual precipitation normals generally trend wetter in the eastern and central U.S. but drier in the western U.S. However, changes in the updated monthly and seasonal precipitation normals vary. At the Northeast’s 35 major climate sites, the spring season got drier in coastal areas and wetter in interior areas. For instance, normal spring precipitation at Central Park, NY, is 0.71" less compared to the previous normals while Harrisburg, PA, got wetter by 0.82".
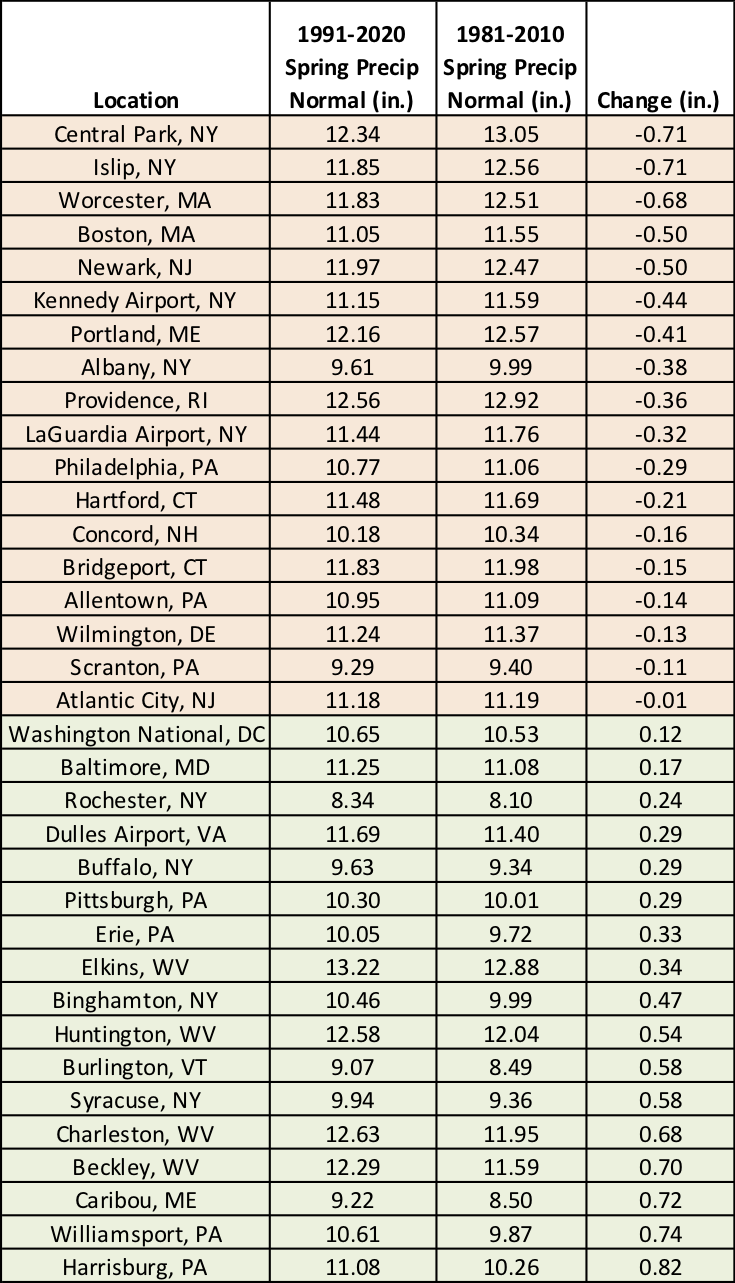
A comparison of spring precipitation normals. Some areas have become drier while others have become wetter.
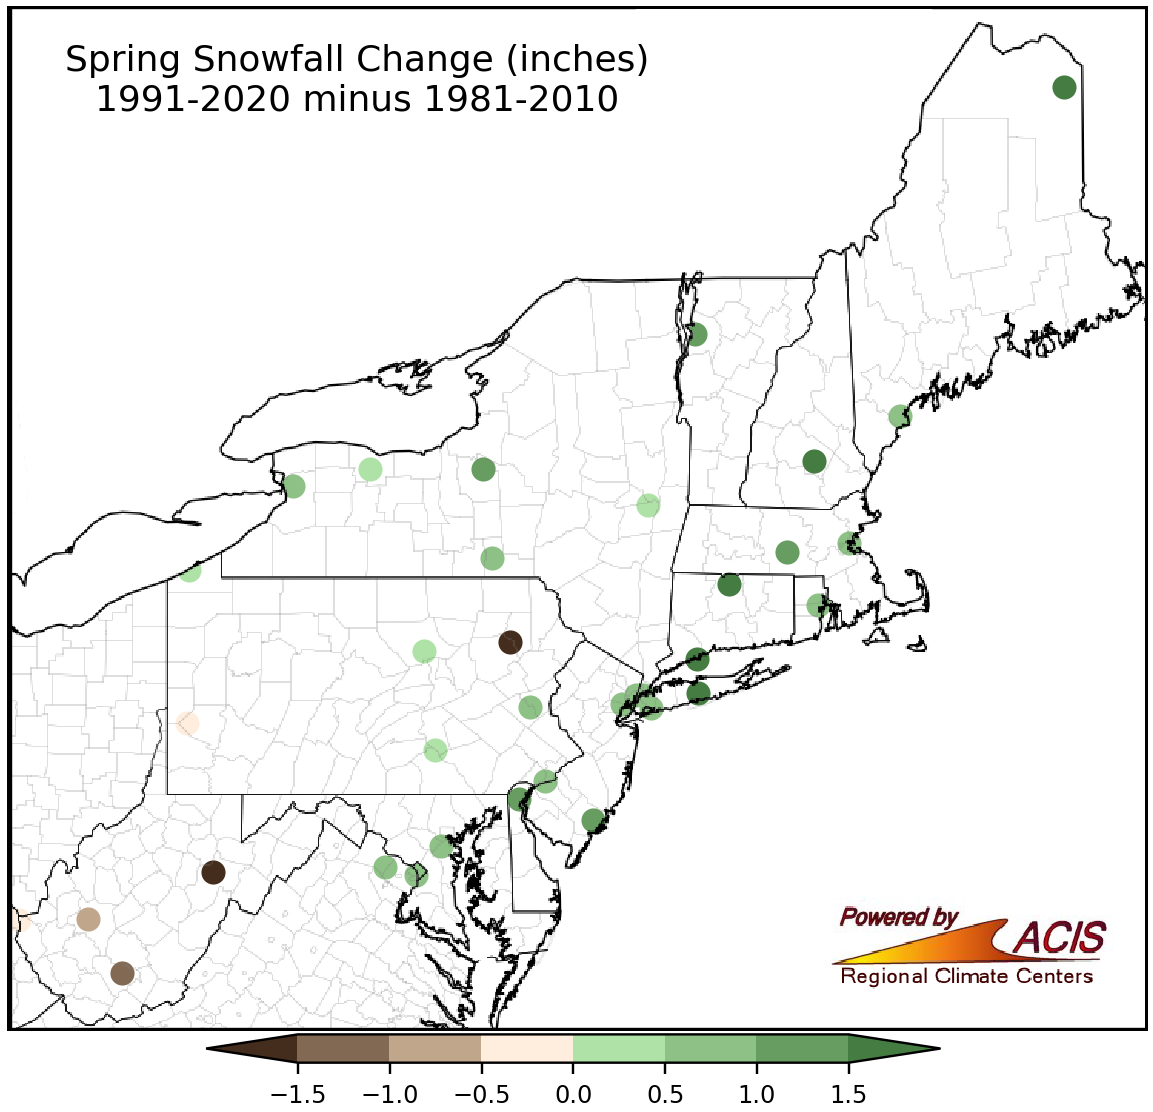
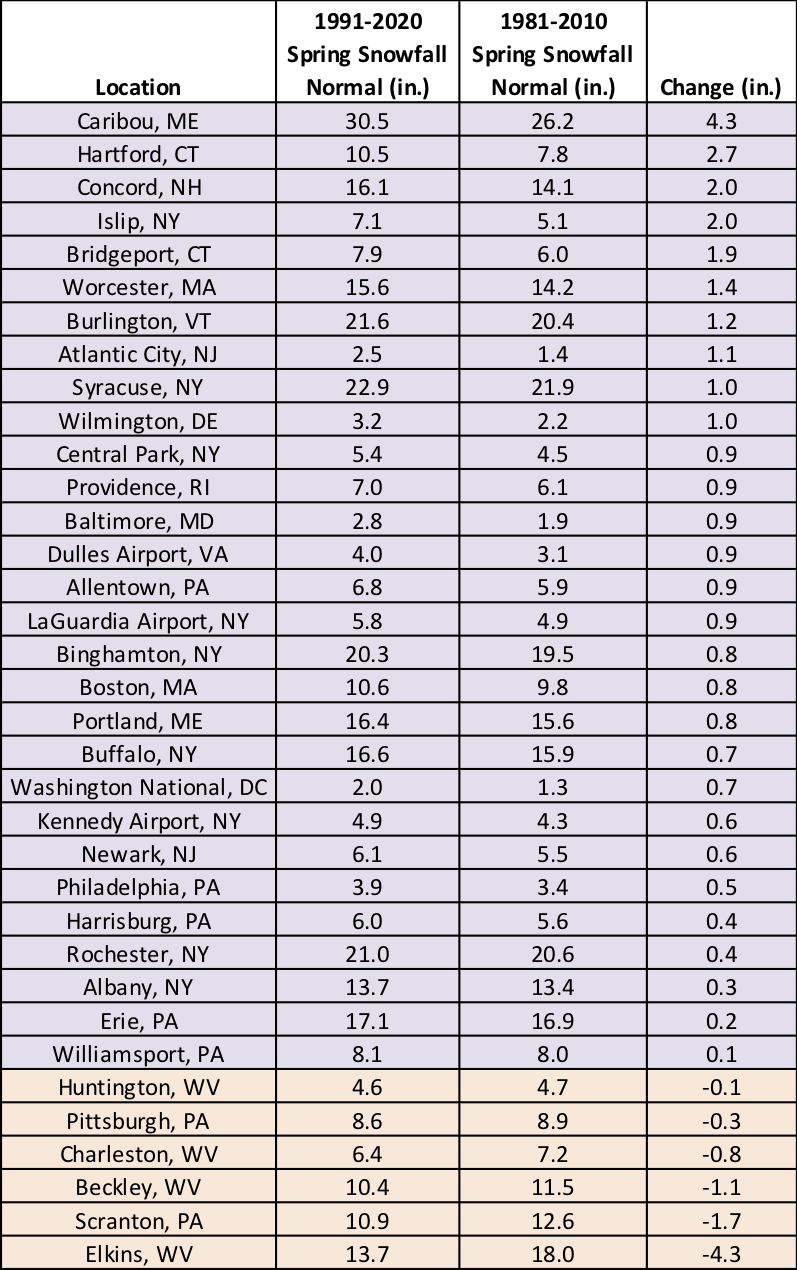
Normal spring snowfall increased for a majority of the Northeast, except in the southwestern corner of the region.
Data from the 35 major climate sites indicates spring has gotten snowier for much of the Northeast, generally driven by an increase in March snowfall (Marches during the 2010s tended to be snowier than Marches during the 1980s). The main exception to this was the southwestern corner of the region, where spring snowfall normals decreased, generally driven by a decrease in April snowfall.
A comparison of spring snowfall normal, with most areas seeing increased snowfall.
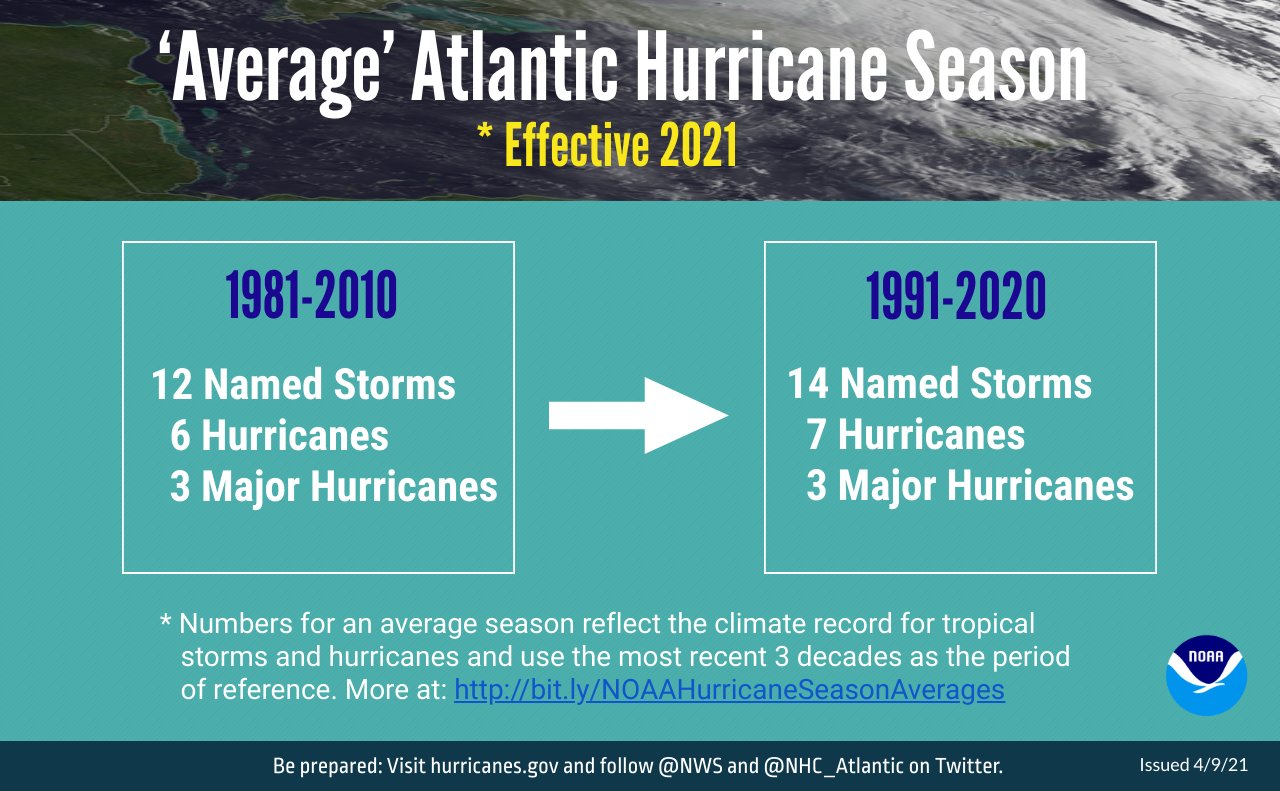
The average Atlantic hurricane season now has more storms. Image credit: NOAA.
Thirty-year averages were also updated for the Atlantic hurricane season. Based on data from 1991–2020, the average season now has 14 named storms, of which seven are expected to become hurricanes, including three major hurricanes. This is an increase of two named storms and one hurricane compared to the 1981–2010 averages.