A Warm February and Winter
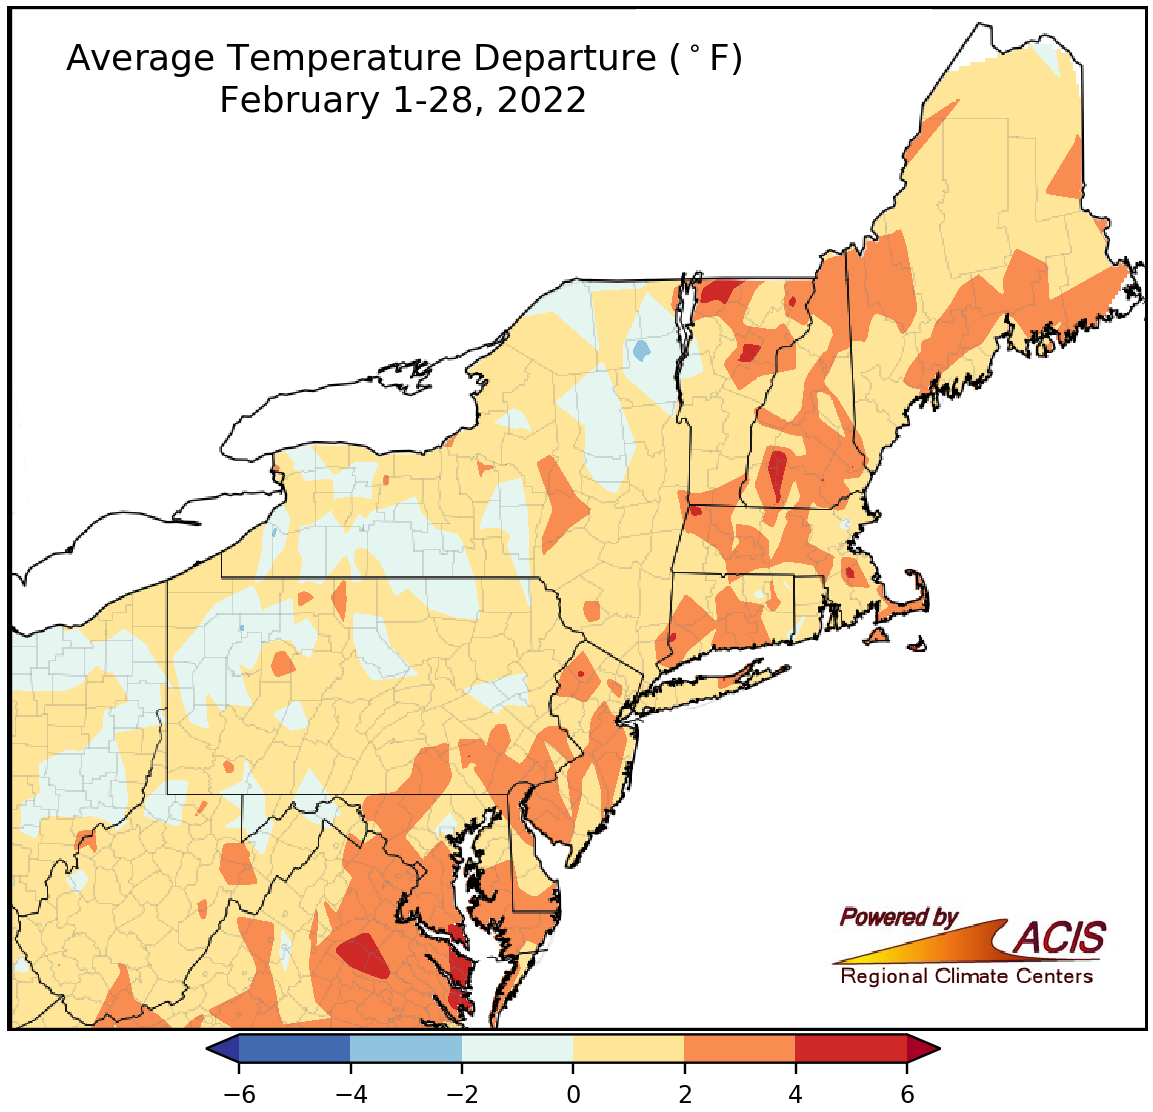
February average temperatures ranged from 2°F below normal to 4°F above normal.
Average temperatures for February ranged from 2°F below normal to 4°F above normal in the Northeast, with most locations being on the warm side of normal, particularly eastern parts of the region. February average temperatures at the 35 major climate sites ranged from 1.3°F below normal in Rochester, NY, to 3.8°F above normal in Philadelphia, PA. Of the 32 major climate sites that experienced a warmer-than-normal February, eight ranked this February among their 20 warmest on record.
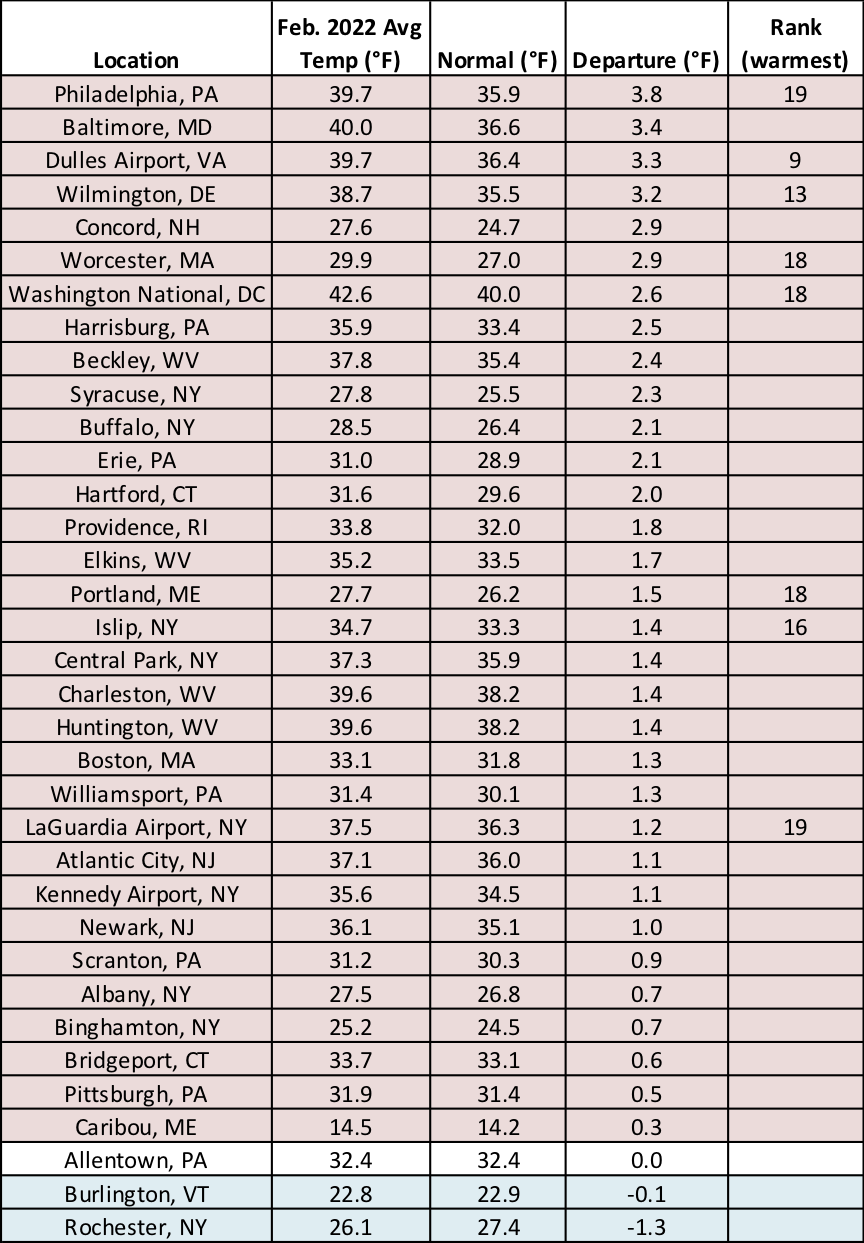
This February was among the 20 warmest on record for eight major climate sites.
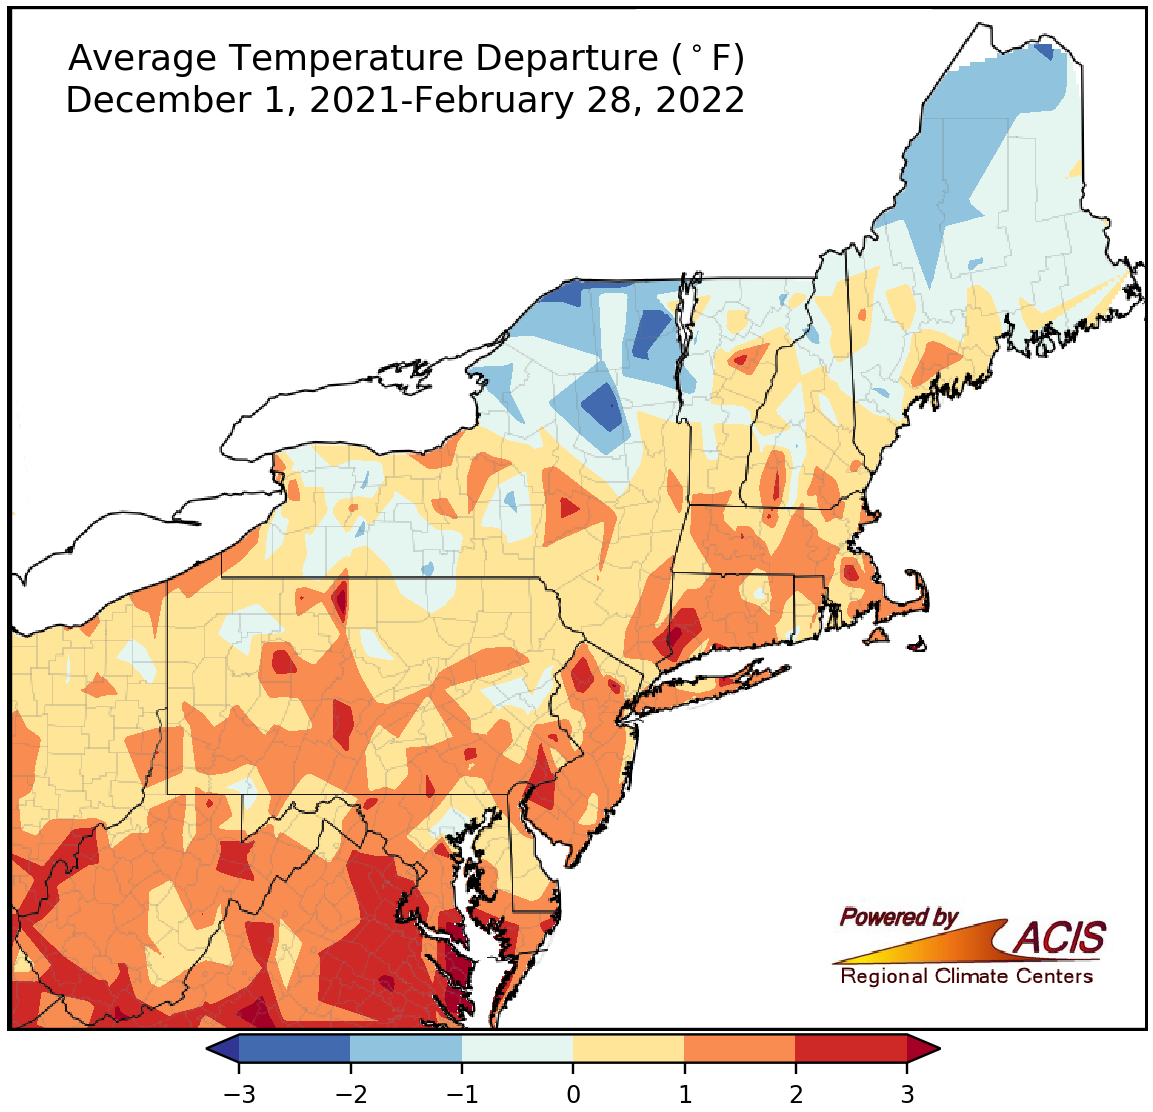
Winter average temperatures ranged from 3°F below normal to 3°F above normal.
After a mild December, cold January, and warm February, winter averaged out to warmer than normal for much of the Northeast, with the warmest locations as much as 3°F above normal. However, some parts of New York and northern New England were colder than normal, with northern New York as much as 3°F below normal. Winter average temperatures at the 35 major climate sites ranged from 1.1°F below normal in Rochester, NY; Caribou, ME; and Burlington, VT, to 3.0°F above normal in Philadelphia, PA, with 30 of the sites wrapping up winter on the warm side of normal. This winter ranked among the 20 warmest on record at 13 of the major climate sites.
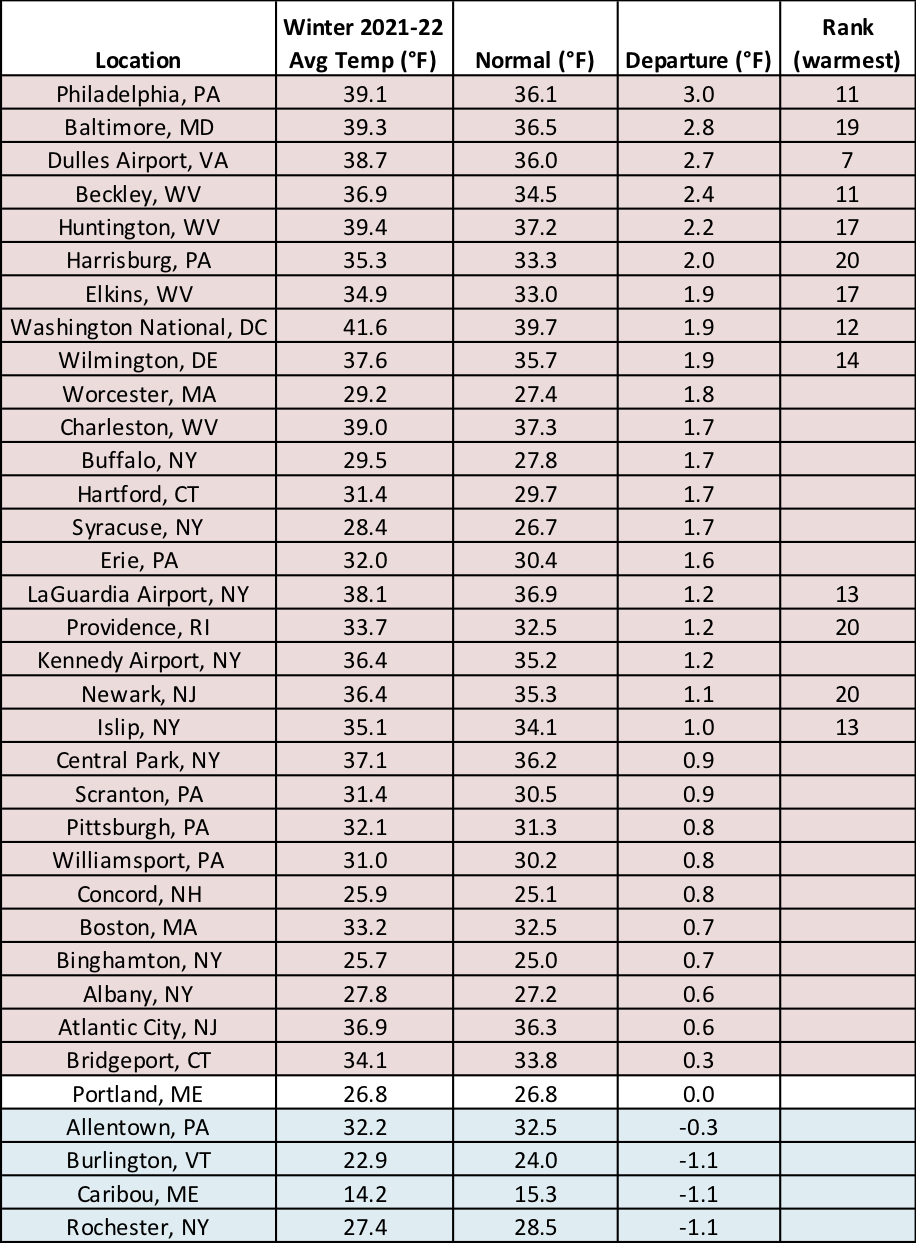
This winter ranked among the 20 warmest on record at 13 of the major climate sites.
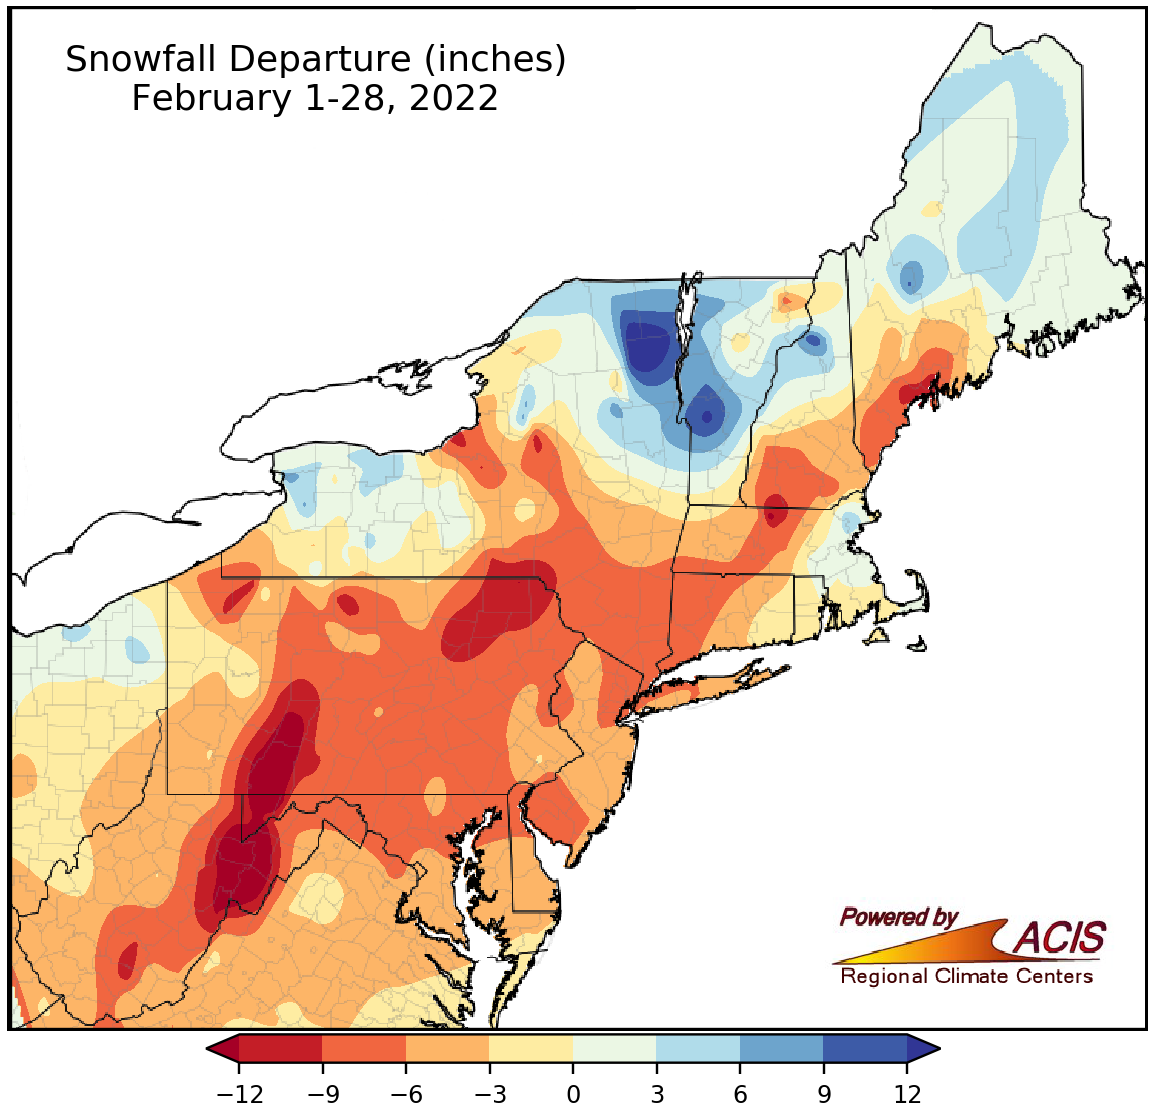
February snowfall ranged from more than 12 inches below normal to more than 12 inches above normal.
Much of the Northeast saw below-normal snowfall during February, with the largest deficits of over 12 inches in higher elevations of eastern West Virginia, western Maryland, and southwestern Pennsylvania. Snowier-than-normal locations were mostly in parts of northern New England, eastern Massachusetts, and western and northern New York, which saw a surplus of more than 12 inches. Thirty of the 35 major climate sites saw below-normal snowfall during February with departures for all the sites ranging from 12.6 inches below normal in Beckley, WV, to 6.3 inches above normal in Burlington, VT. This February was among the 20 least snowy on record for 12 major climate sites but ranked as Burlington’s 16th snowiest.
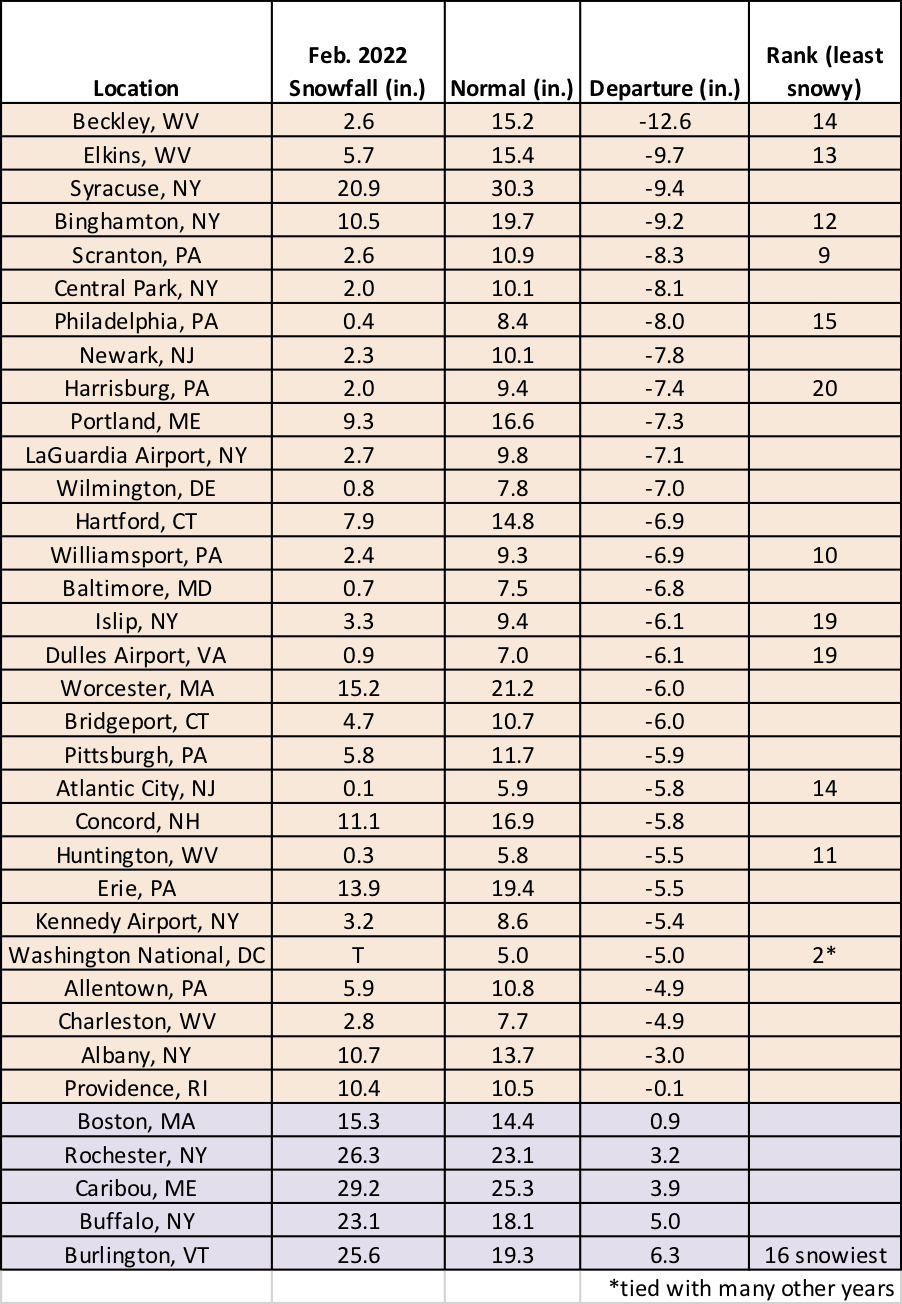
This February was among the 20 least snowy on record for 12 major climate sites but ranked as the 16th snowiest for Burlington, VT.
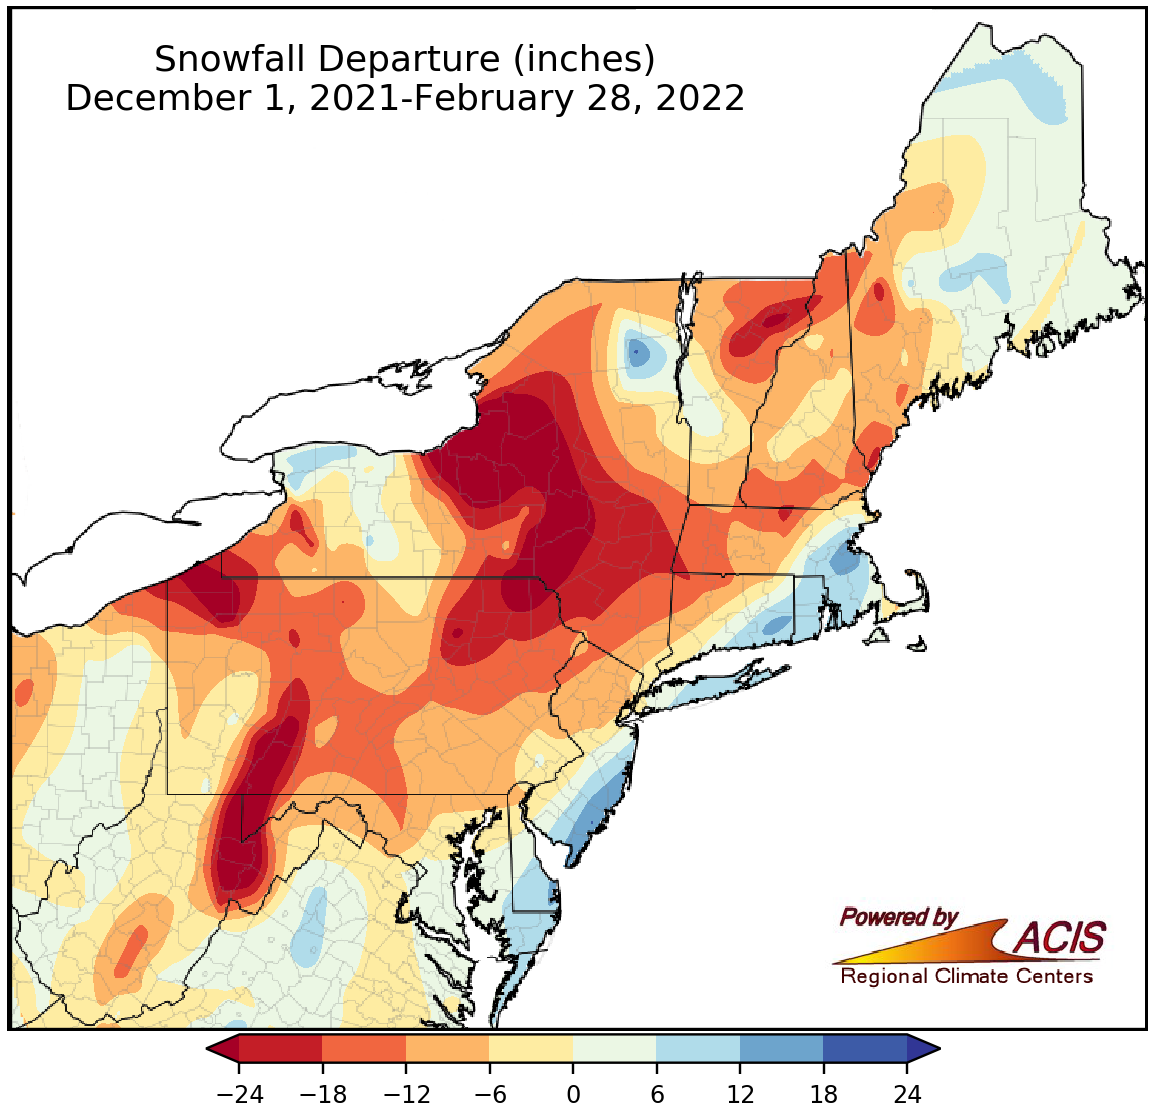
Winter snowfall ranged from more than 24 inches below normal to 18 inches above normal.
While December and February snowfall were below normal for many areas, January featured several storms that dropped heavy snow on coastal sites, strongly influencing winter snowfall totals in those locations. Much of the Northeast saw below-normal winter snowfall, with the largest deficits of more than 24 inches in parts of central New York, western Pennsylvania, western Maryland, and northern West Virginia. However, coastal areas from southeastern Maryland to eastern Massachusetts saw a snowfall surplus, up to 18 inches in a locations such as southeastern New Jersey. Winter snowfall at the 35 major climate sites ranged from 41.0 inches below normal in Syracuse, NY, to 18.5 inches above normal in Atlantic City, NJ, with 24 of the sites seeing below-normal winter snowfall. This winter ranked among the 20 least snowy for two of the sites but among the 20 snowiest for four of the sites.
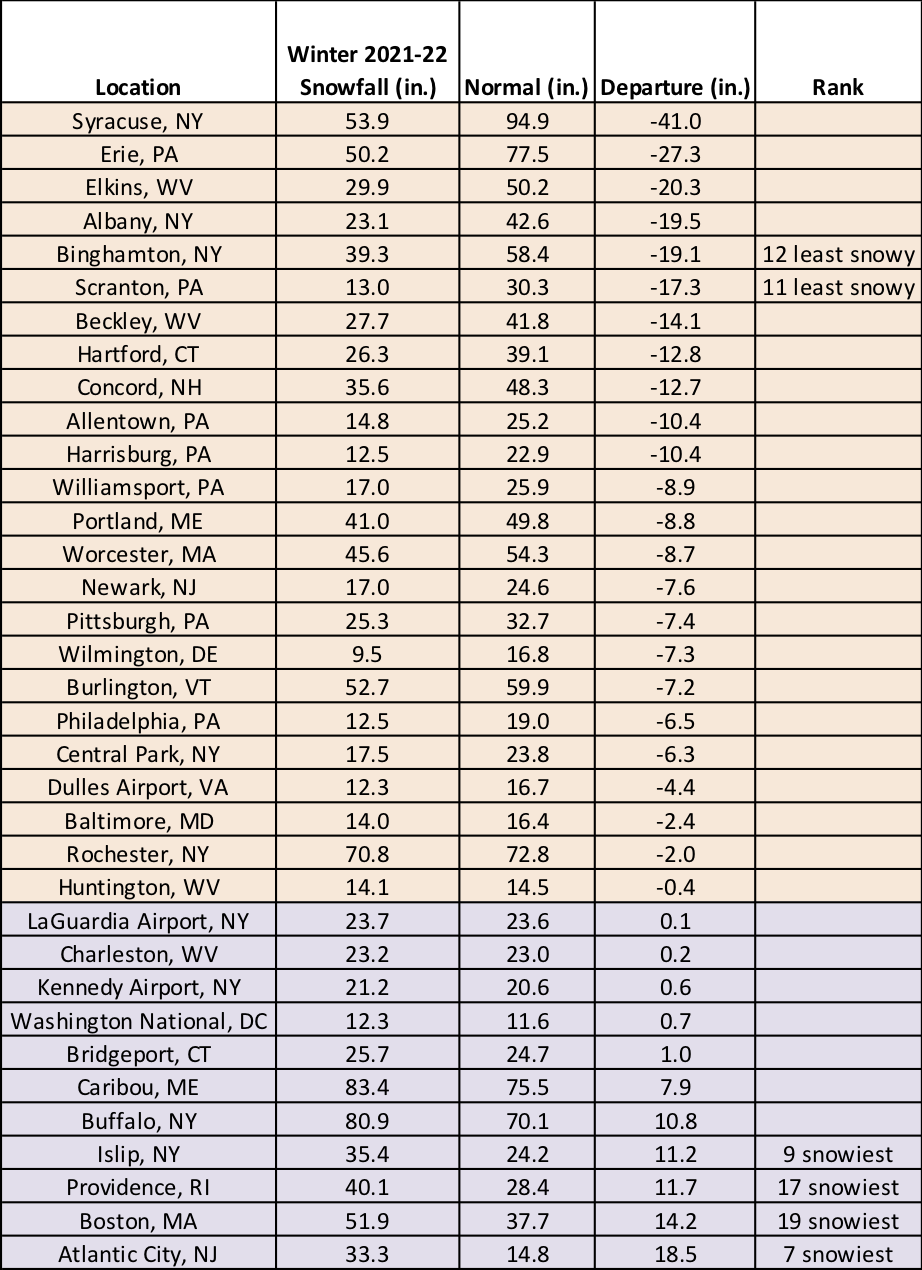
This winter ranked among the 20 least snowy for two major climate sites but among the 20 snowiest for four major climate sites.
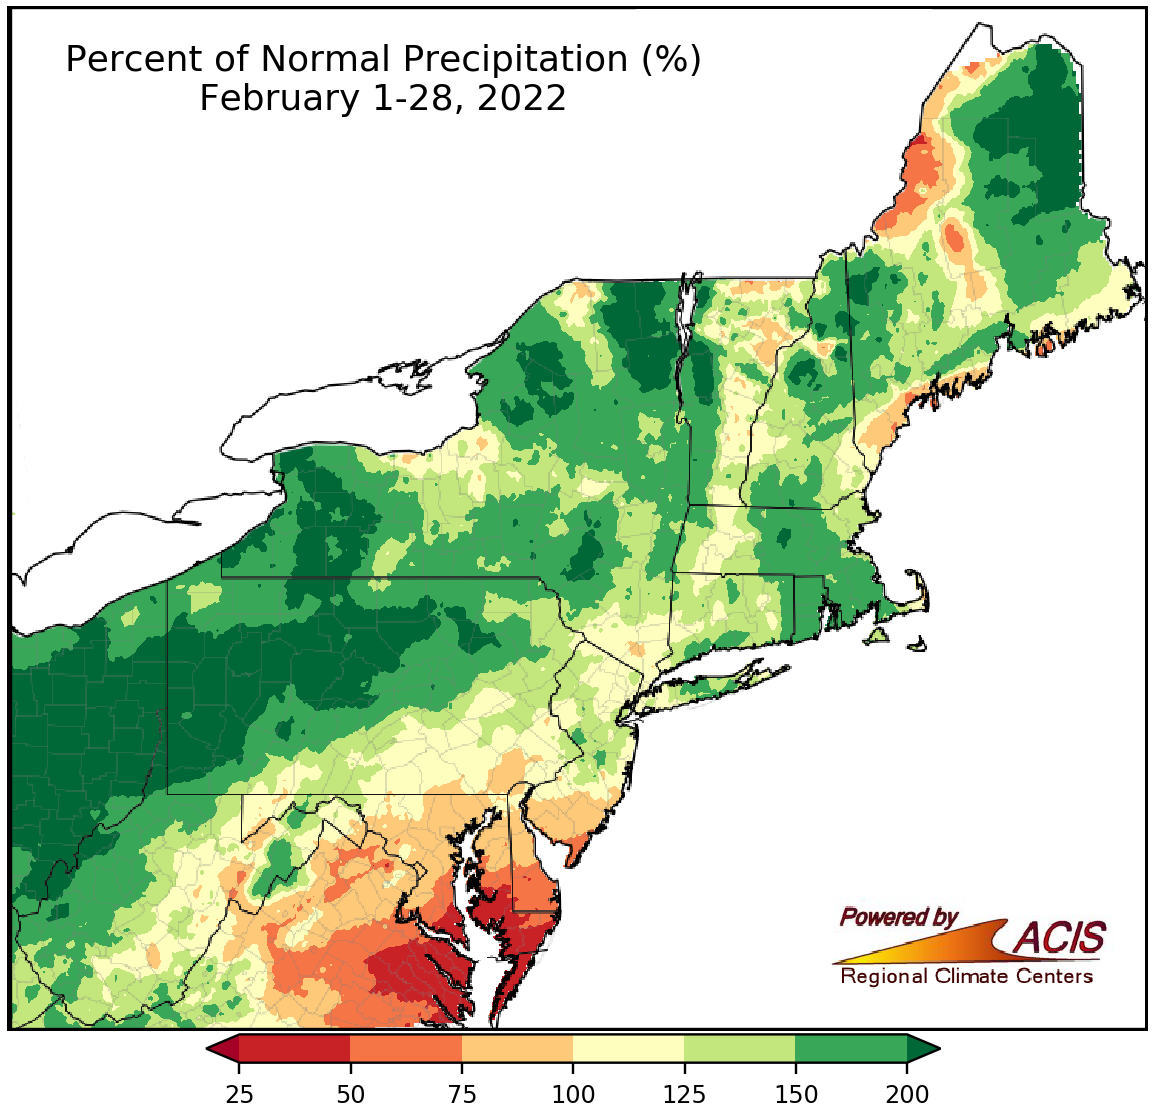
February precipitation ranged from 25% of normal to more than 200% of normal.
There were multiple storms during February; however, they produced a mix of precipitation types instead of just snow. Most of the Northeast was wetter than normal during February, with the wettest locations in parts of West Virginia, Pennsylvania, New York, and northern New England seeing more than 200% of normal precipitation. However, the southeastern corner of the region was drier than normal, with the driest locations in southern and eastern Maryland seeing between 25% and 50% of normal precipitation. Thirty of the 35 major climate sites experienced a wetter-than-normal February, with 12 of the sites having one of their 20 wettest Februarys on record. Overall, precipitation at all the sites ranged from 80% of normal in Baltimore, MD, to 198% of normal in Williamsport, PA.
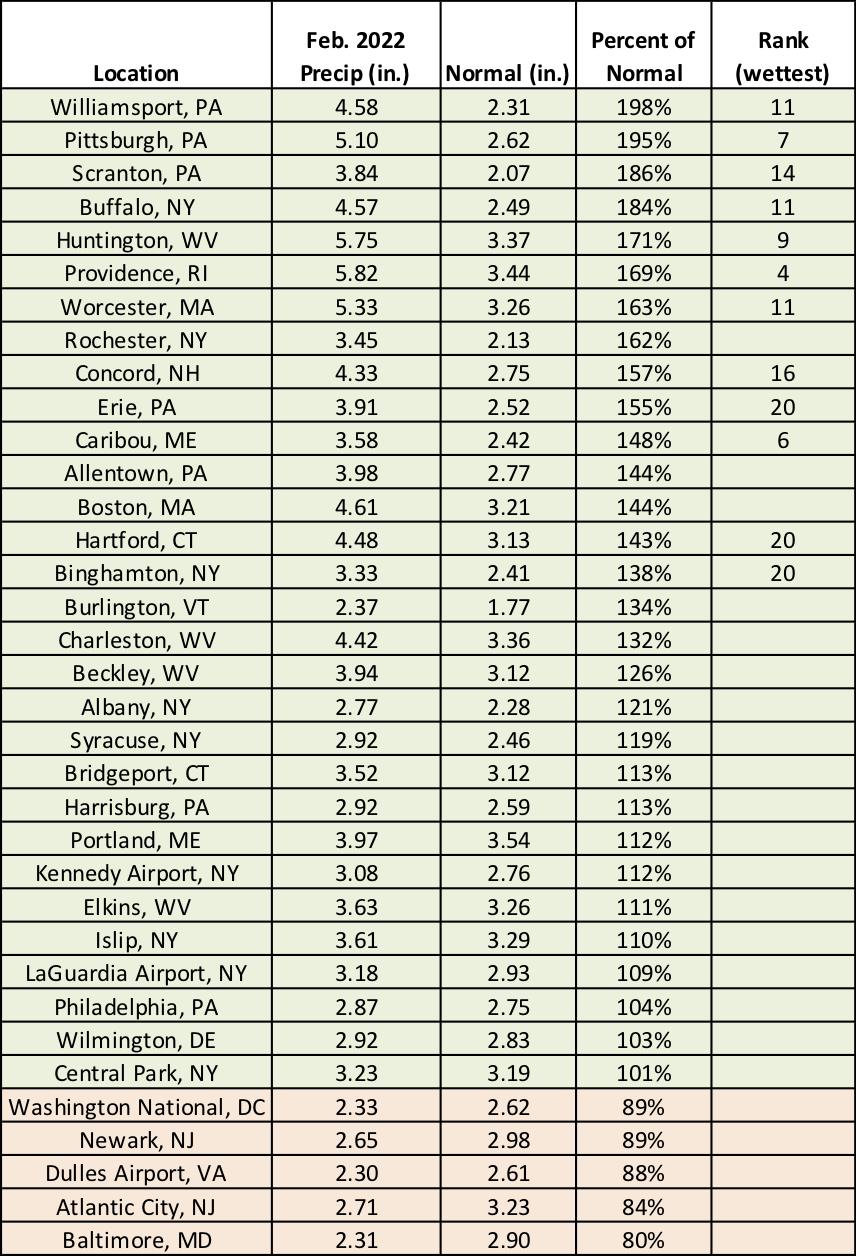
Twelve of major climate sites had one of their 20 wettest Februarys on record.
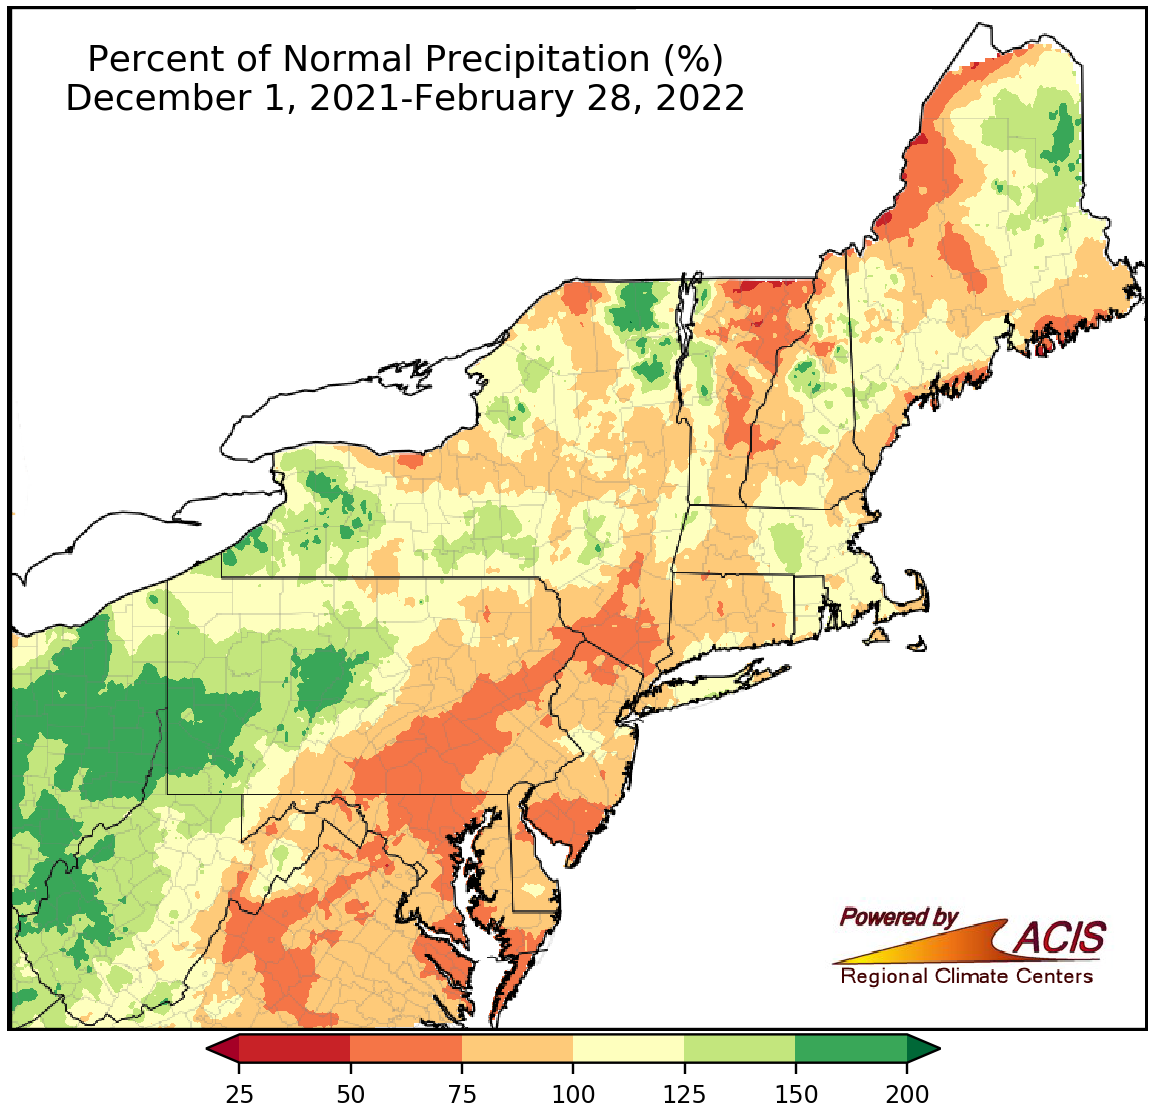
Winter precipitation ranged from 50% of normal to 200% of normal.
A drier-than-normal December, polarized January, and wetter-than-normal February averaged out to variable winter precipitation, ranging from 50% of normal in an area from southern Maryland to southeastern New York and in parts of Vermont and Maine to 200% of normal in western West Virginia, western Pennsylvania, and northern New York. Winter precipitation at the 35 major climate sites ranged from 72% of normal in Wilmington, DE, to 142% of normal in Huntington, WV, with 22 of the sites on the dry side of normal. This winter ranked among the 20 driest on record for two of the sites but among the 20 wettest for three of the sites.
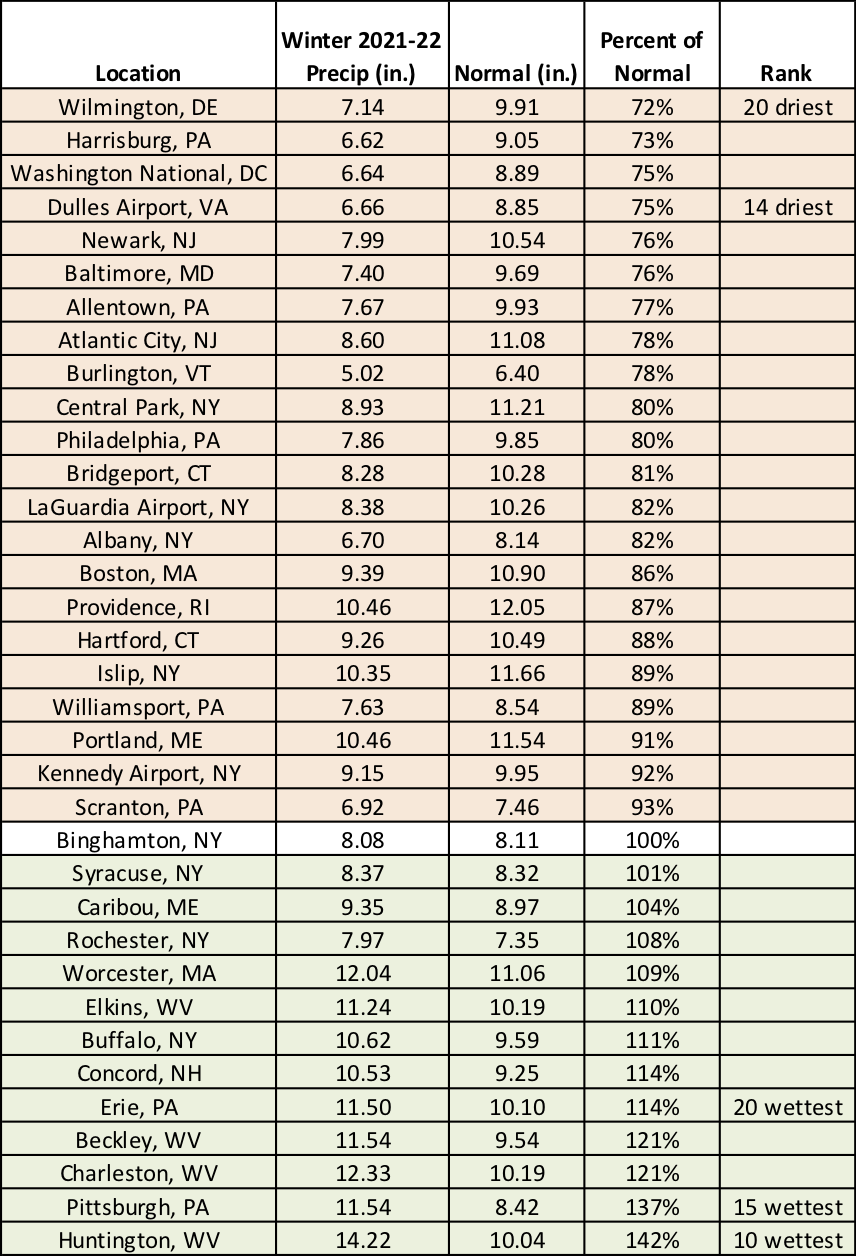
This winter ranked among the 20 driest for two major climate sites but among the 20 wettest for three major climate sites.
For March, NOAA’s Climate Prediction Center indicates a tilt toward above-normal precipitation and above-normal temperatures for much of the Northeast. Equal chances were predicted for areas with no clear climate signal.
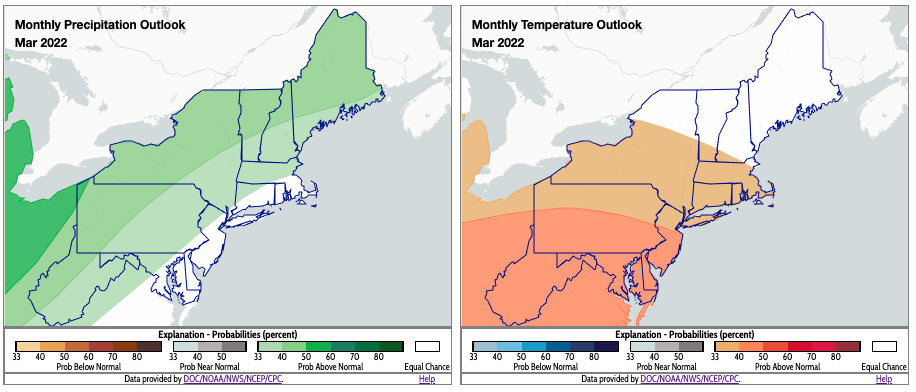
Much of the Northeast is expected to see a wetter-than-normal and warmer-than-normal March. Click to enlarge.