A Record Hot August Closes Out Summer
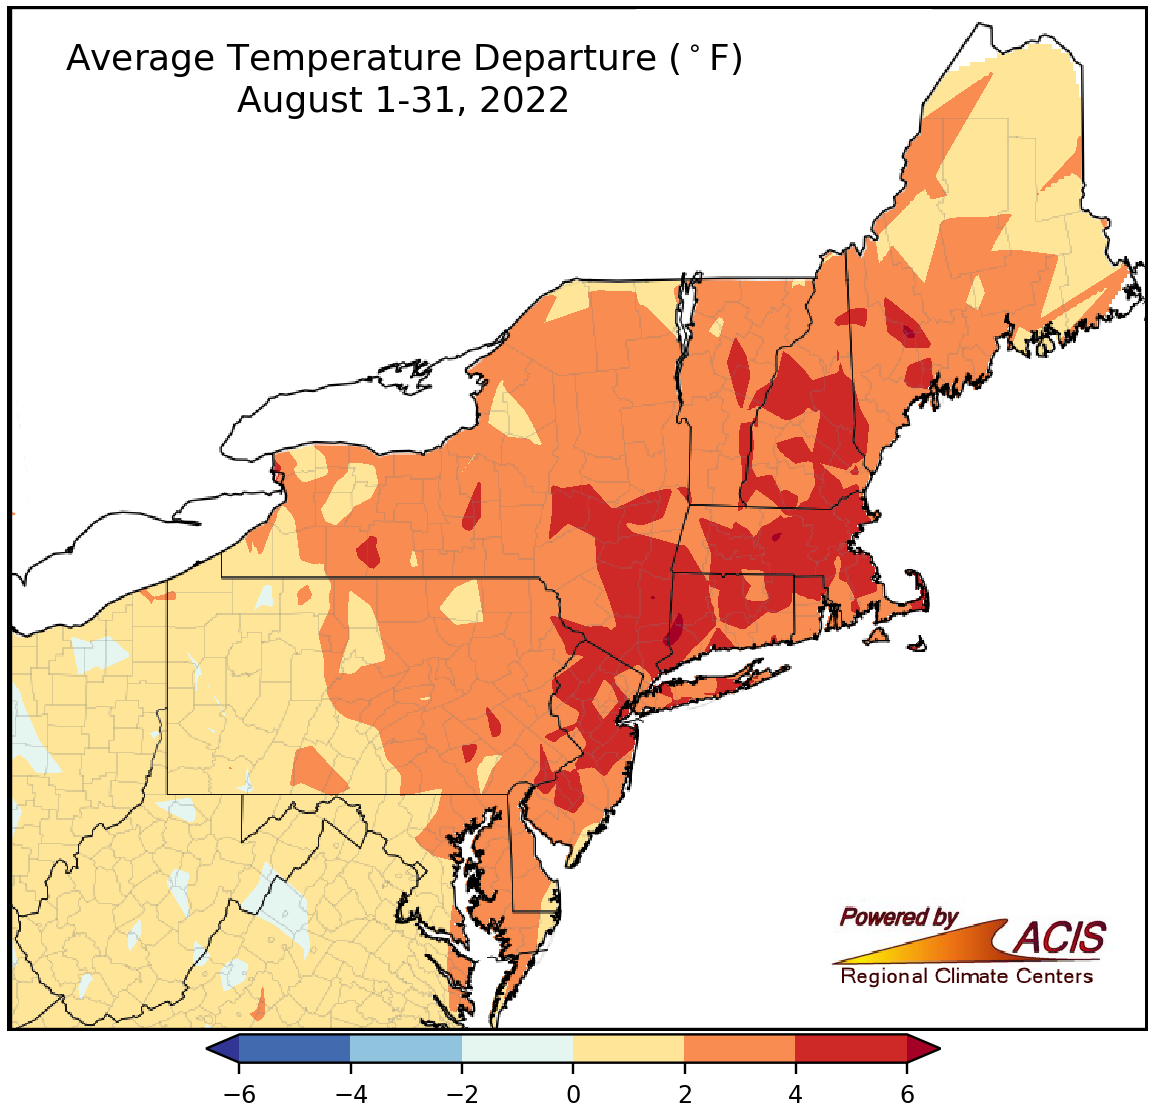
August average temperatures ranged from 2°F below normal to 6°F above normal.
Most of the Northeast experienced a hotter-than-normal August, with the hottest locations in parts of New England, New York, New Jersey, and eastern Pennsylvania being 4°F to 6°F above normal. This August was the hottest on record for eight major climate sites and ranked among the 20 hottest for another 22 of the sites. In fact, this August was among the 20 all-time hottest months on record for 19 major climate sites. August average temperatures for all 35 major climate sites ranged from 0.2°F above normal in Huntington, WV, to 4.5°F above normal in Philadelphia, PA, and Worcester, MA.
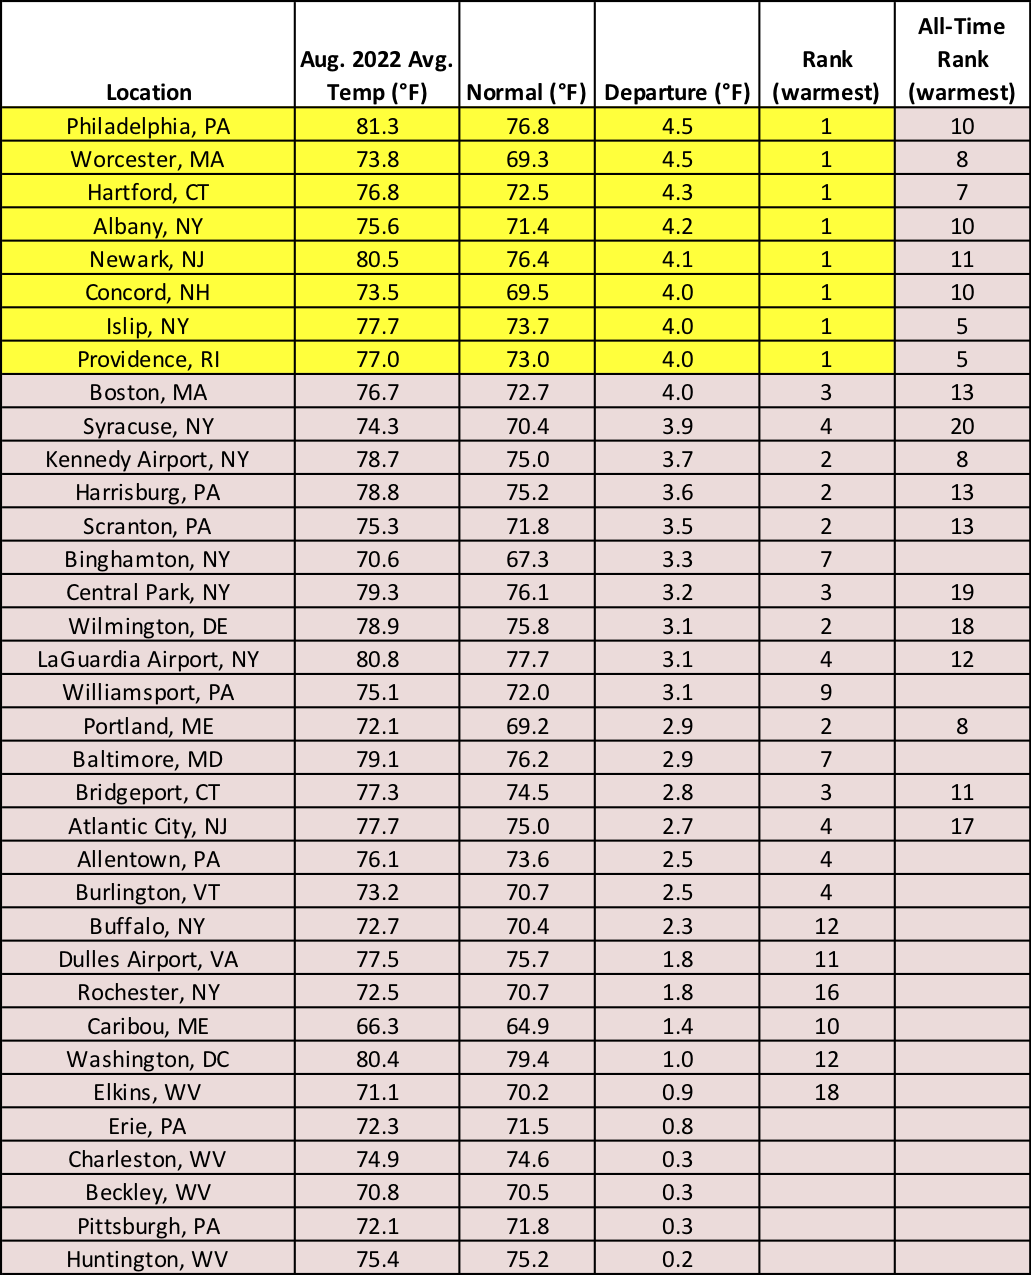
This August was record hot for eight major climate sites and ranked among the 20 hottest for another 22 of the sites.
Similar to July, August featured an unusually large number of days with highs at or above 90°F and lows at or above 75°F. The number of days meeting those thresholds ranked among the 10 greatest for August at multiple sites. For instance, Philadelphia, PA, and Newark, NJ, recorded a high of at least 90°F during more than half of August, 19 days and 18 days respectively, their greatest number for August on record and among the 10 greatest for any month on record. Philadelphia also saw 11 days with a low at or above 75°F, its greatest number for August and tying as its fifth greatest for any month on record. Meanwhile, Hartford, CT, had three such days, tying as its greatest for any month on record. Several sites saw a near-record or record number of consecutive days with a low of at least 75°F, as well.
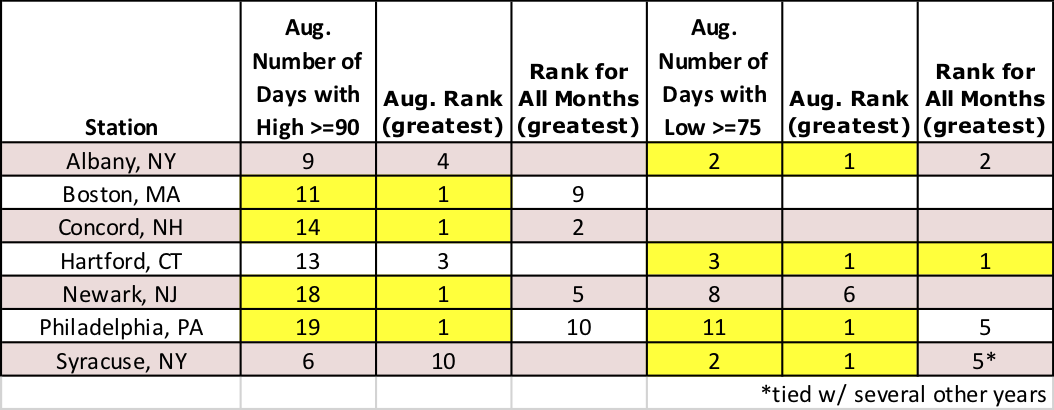
Several sites had a record number of days with a high of at least 90°F or a low of at least 75°F during August.
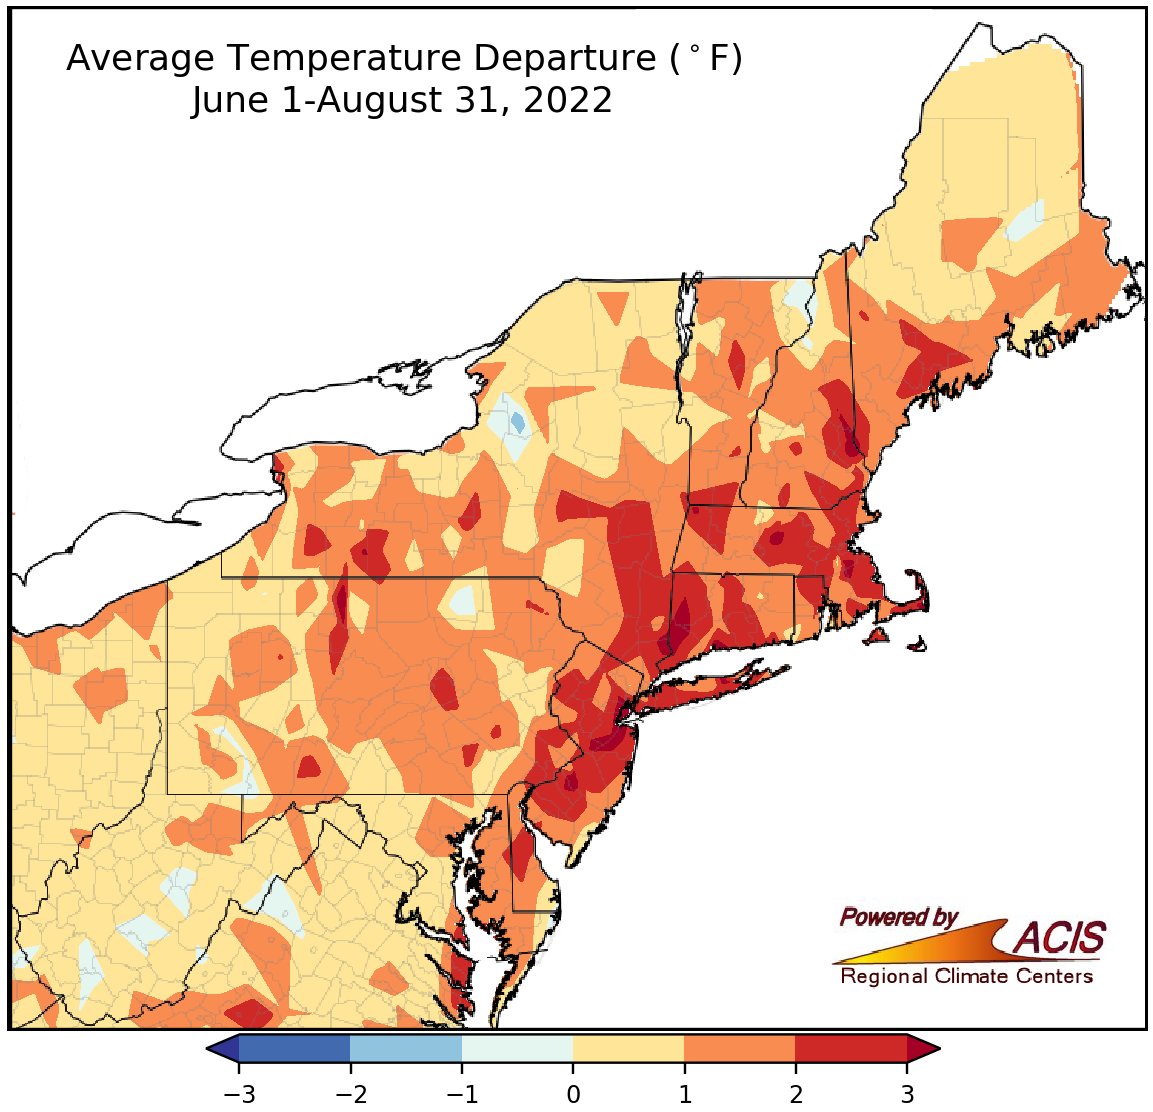
Summer average temperatures ranged from 1°F below normal to more than 3°F above normal.
While June average temperatures varied, the heat of July and August pushed summer to be hotter than normal for much of the Northeast, with the hottest locations such as western Connecticut and northern New Jersey being more than 3°F above normal. In fact, Newark, NJ, recorded its hottest summer on record and another 27 major climate sites had one of their 20 hottest summers on record. Summer average temperatures at the 35 major climates sites ranged from 0.1°F above normal in Erie, PA, to 3.5°F above normal in Newark.
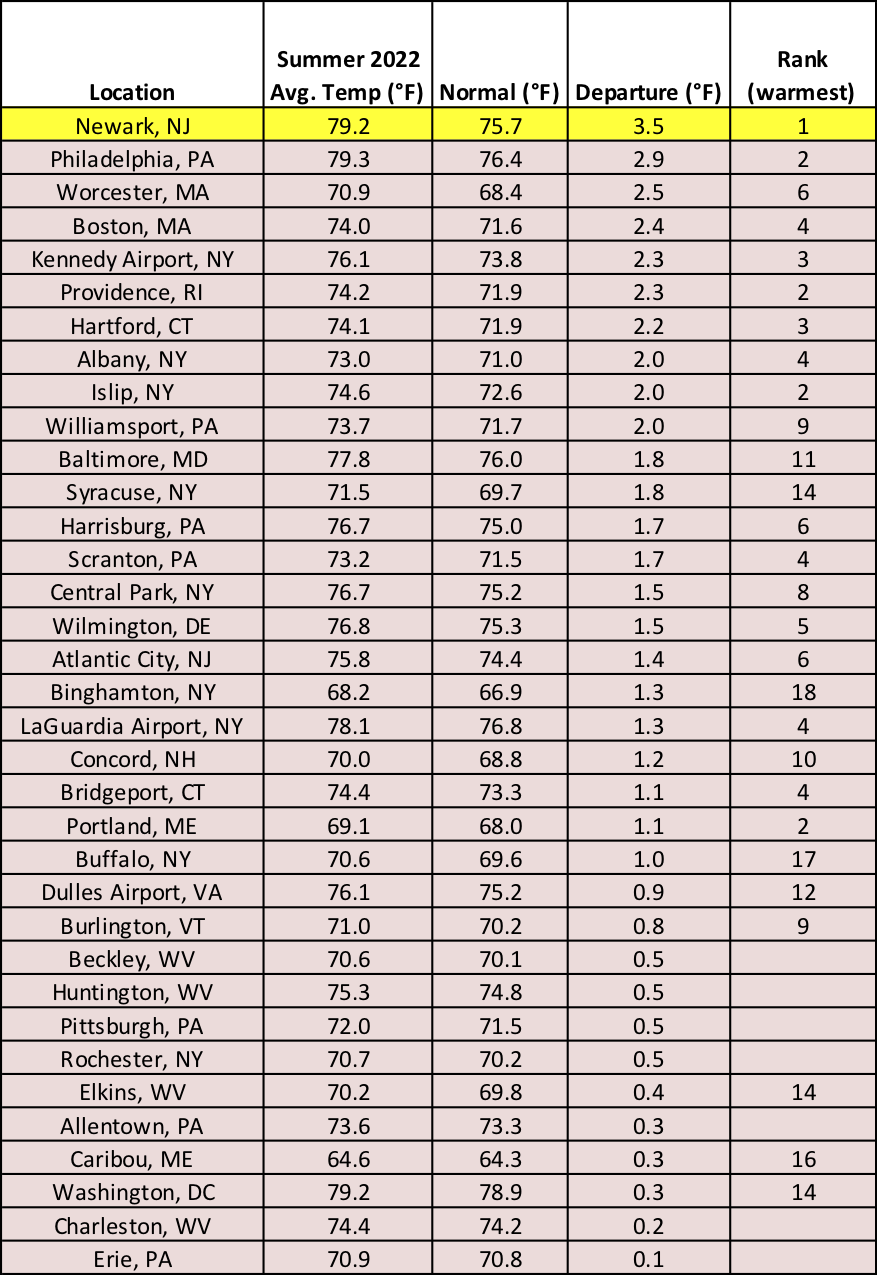
Summer 2021 was the hottest on record for Newark, NJ, and among the 20 hottest for 27 additional major climate sites.
The number of hot days and/or unusually warm nights during summer was notable at multiple sites. For instance, Providence, RI, recorded 10 summer days with a high of at least 95°F, tying as its greatest number for the season. Meanwhile, Philadelphia, PA, had 57 days during summer that the low remained at or above 70°F, tying its record for summer, and 26 summer days with a low at or above 75°F, setting a new record for the season and beating the old record by five days. Harrisburg, PA, and Hartford, CT, also set/tied their records for summer days with a low of at least 75°F.
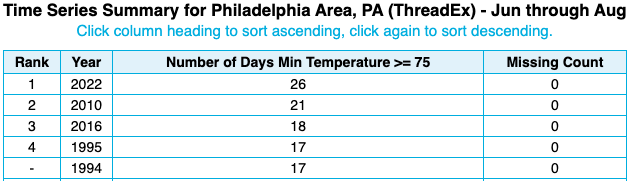
Philadelphia, PA, saw a record-setting 26 days with a low at or above 75°F during summer.
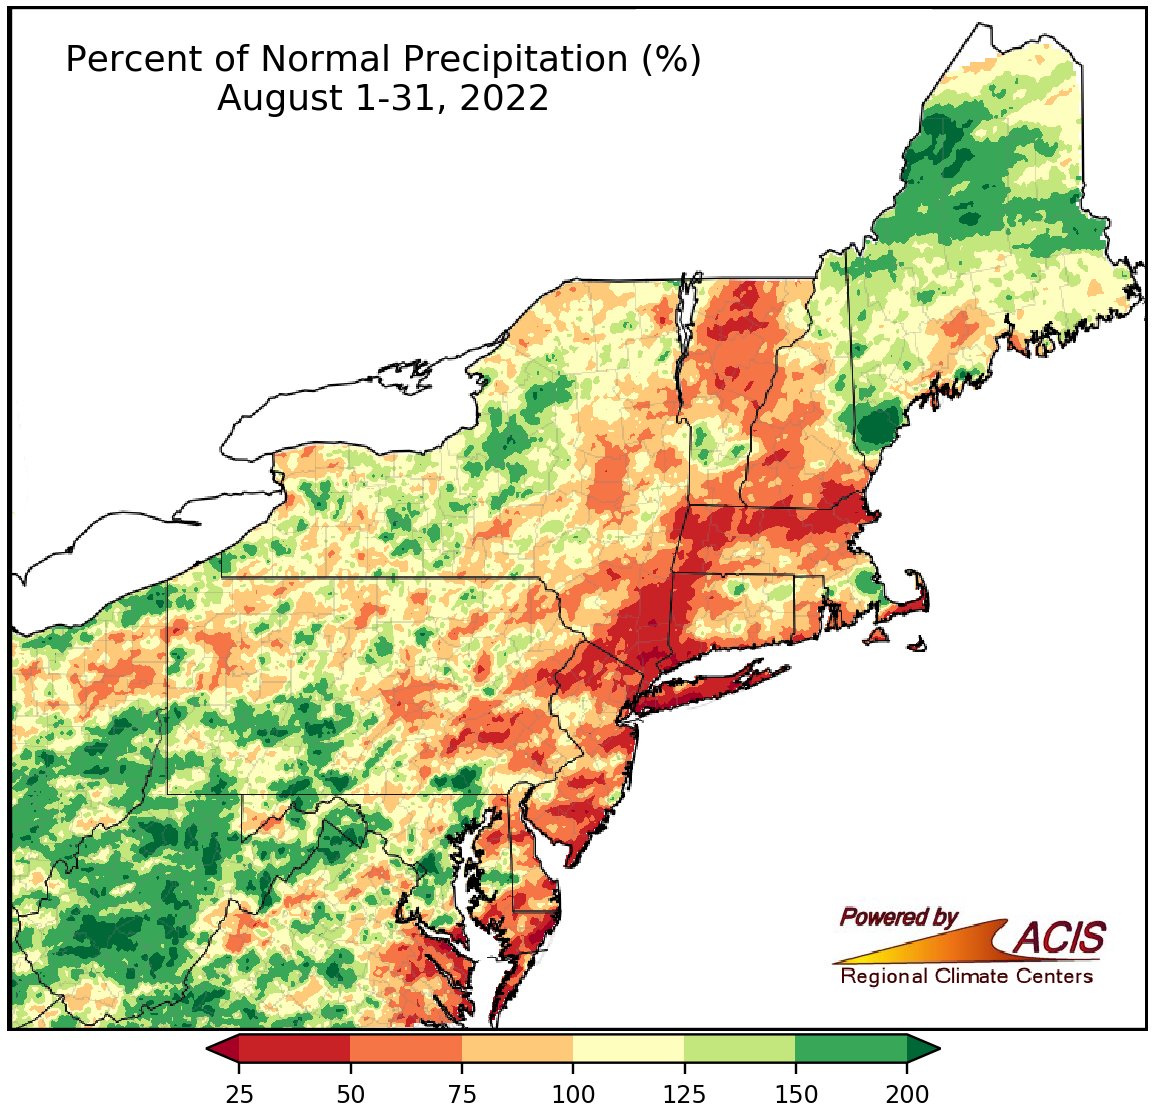
August precipitation ranged from less than 25% of normal to more than 200% of normal.
August rainfall varied greatly, from less than 25% of normal in a few coastal areas to more than 200% of normal in parts of West Virginia and Maine. At the 35 major climate sites, August rainfall ranged from 16% of normal in Islip, NY, to 247% of normal in Charleston, WV. Overall, 25 of the sites were drier than normal with 10 ranking this August among their 20 driest on record. However, four sites experienced one of their 20 wettest Augusts on record.
Persistent below-normal precipitation contributed to the expansion and intensification of drought conditions in multiple parts of the Northeast. For more details on the drought, check out the weekly drought update and the Northeast DEWS Dashboard. However, portions of West Virginia dealt with multiple rounds of flash flooding.
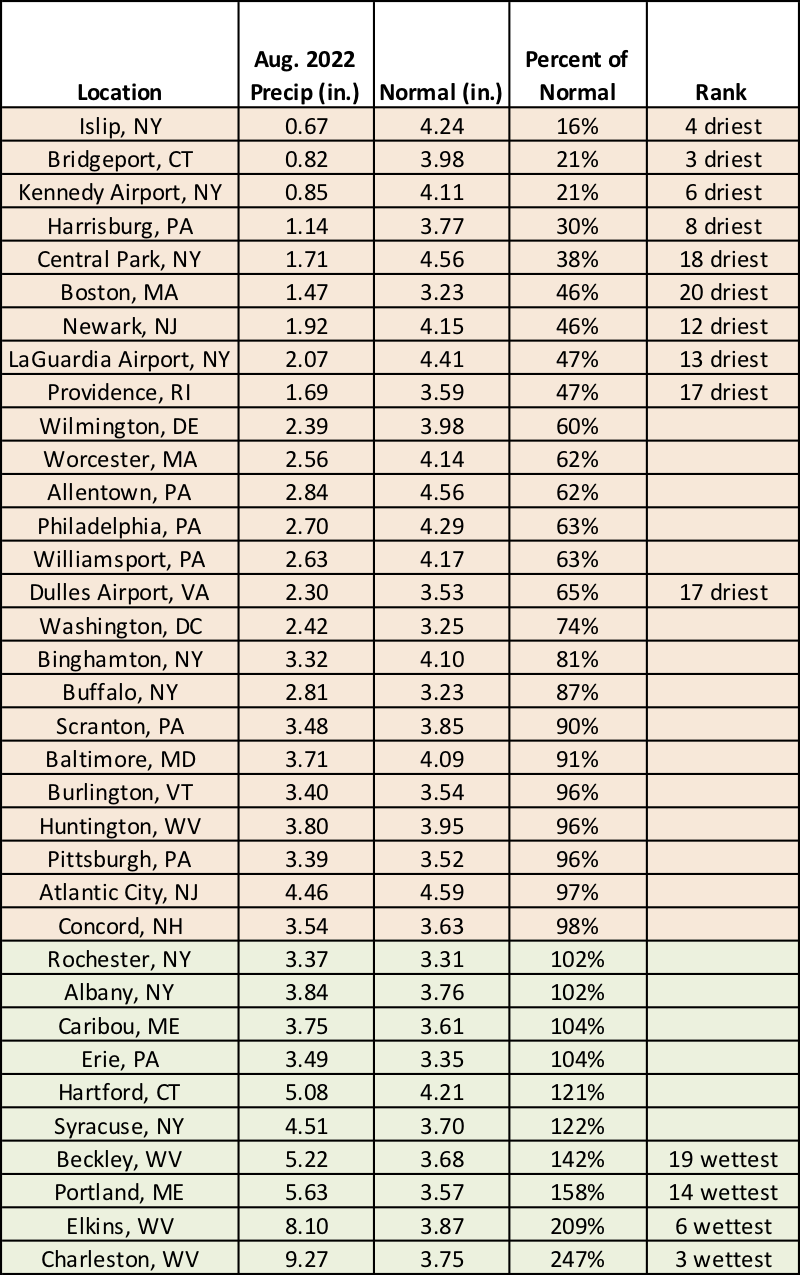
This August ranked among the 20 driest for 10 of the climate sites but among the 20 wettest for four others.
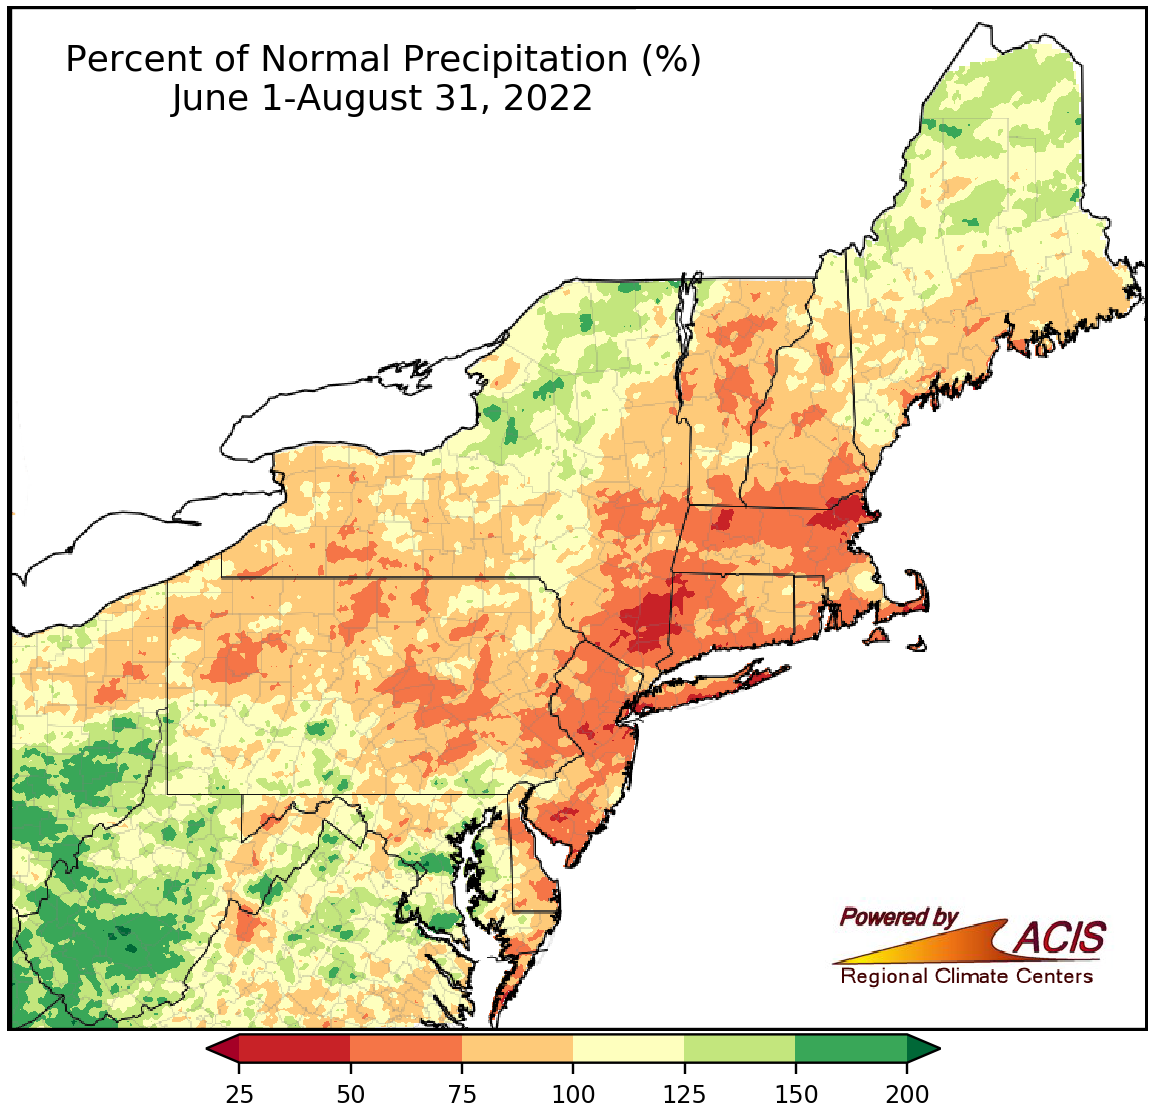
Summer precipitation ranged from 25% of normal to 200% of normal.
Much of the Northeast saw below- or near-normal summer precipitation, with the driest locations in New England, southeastern New York, and New Jersey seeing between 25% and 50% of normal rainfall. Meanwhile, some extreme southern and northern areas tended to be wetter with parts of West Virginia seeing up to 200% of normal rainfall. At the 35 major climate sites, summer rainfall ranged from 37% of normal in Newark, NJ, to 176% of normal in Charlestons, WV, its wettest summer on record. Twenty-seven of the major climate sites were drier than normal with nine ranking this summer among their 20 driest. However, this summer was among the 20 wettest on record for five major climate sites.
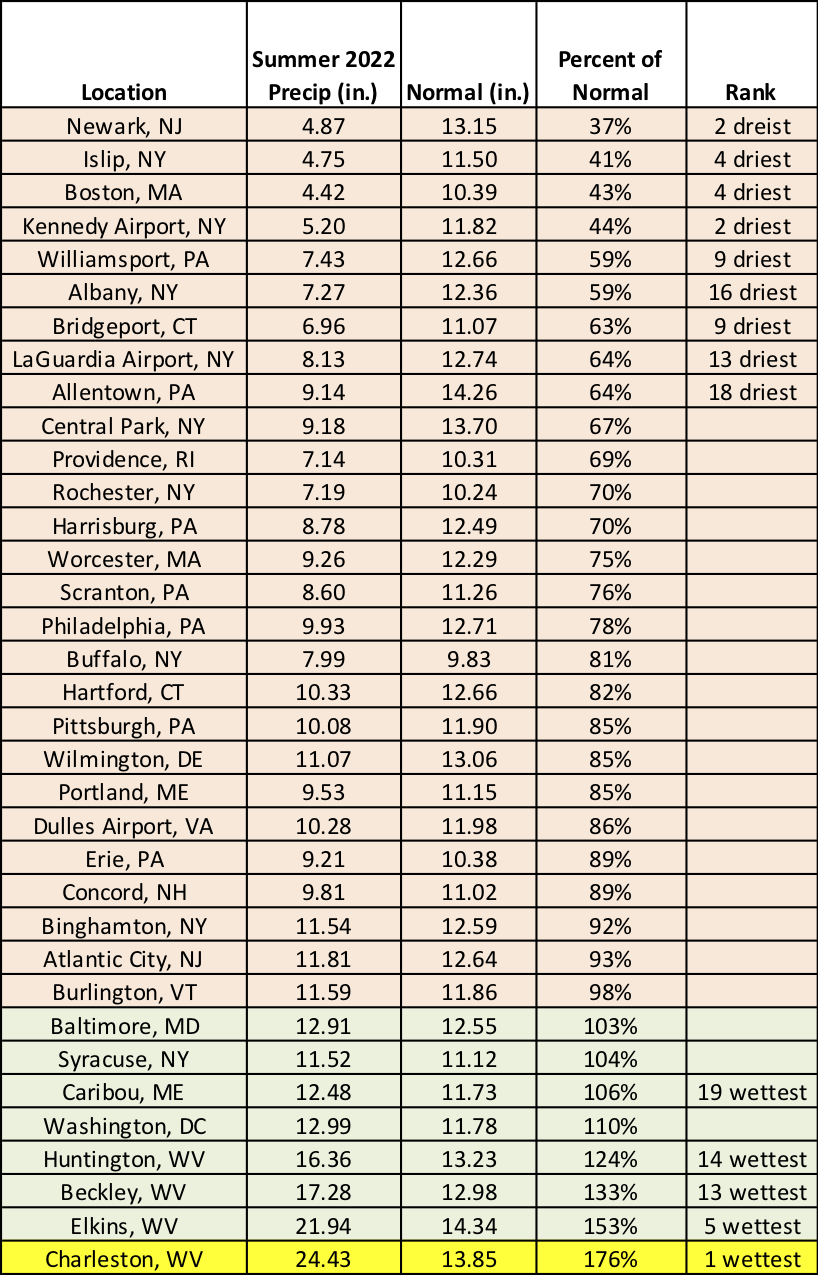
This summer ranked among the 20 driest for nine of the climate sites but among the 20 wettest for five others including Charleston, WV, which was record wet.
For September, NOAA’s Climate Prediction Center indicates an increased likelihood of above-normal temperatures for the entire Northeast. There’s a tilt toward below-normal precipitation for much of New England and parts of New York, with equal chances of below-, near-, or above-normal precipitation predicted for the rest of the region.
September is expected to average out to be warmer than normal.
Parts of New England and New York could continue to see drier-than-normal conditions.