May Days
Much of the Northeast experienced colder-than-normal temperatures during the first half of May.
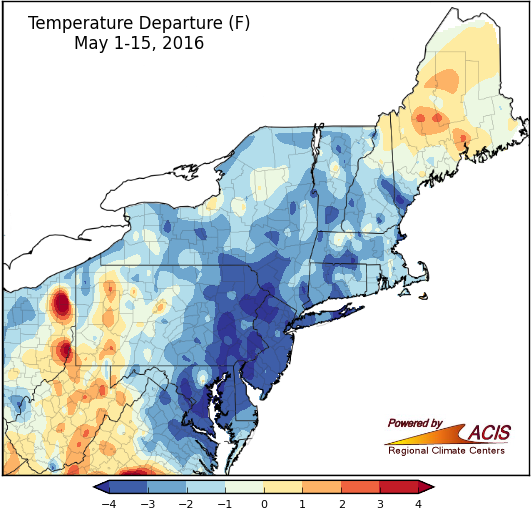
During the first half of May, average temperatures generally ranged from more than 4°F below normal to 2°F above normal. The majority of the region saw near- to below-normal temperatures, with the coolest spots along the Interstate 95 corridor from Washington, DC to New York City. The warmest spots were found at opposite ends of the region in West Virginia and Maine. All but two of the region’s 35 major climate sites were colder than normal, with eleven sites ranking the period among their top 20 coldest starts to May.
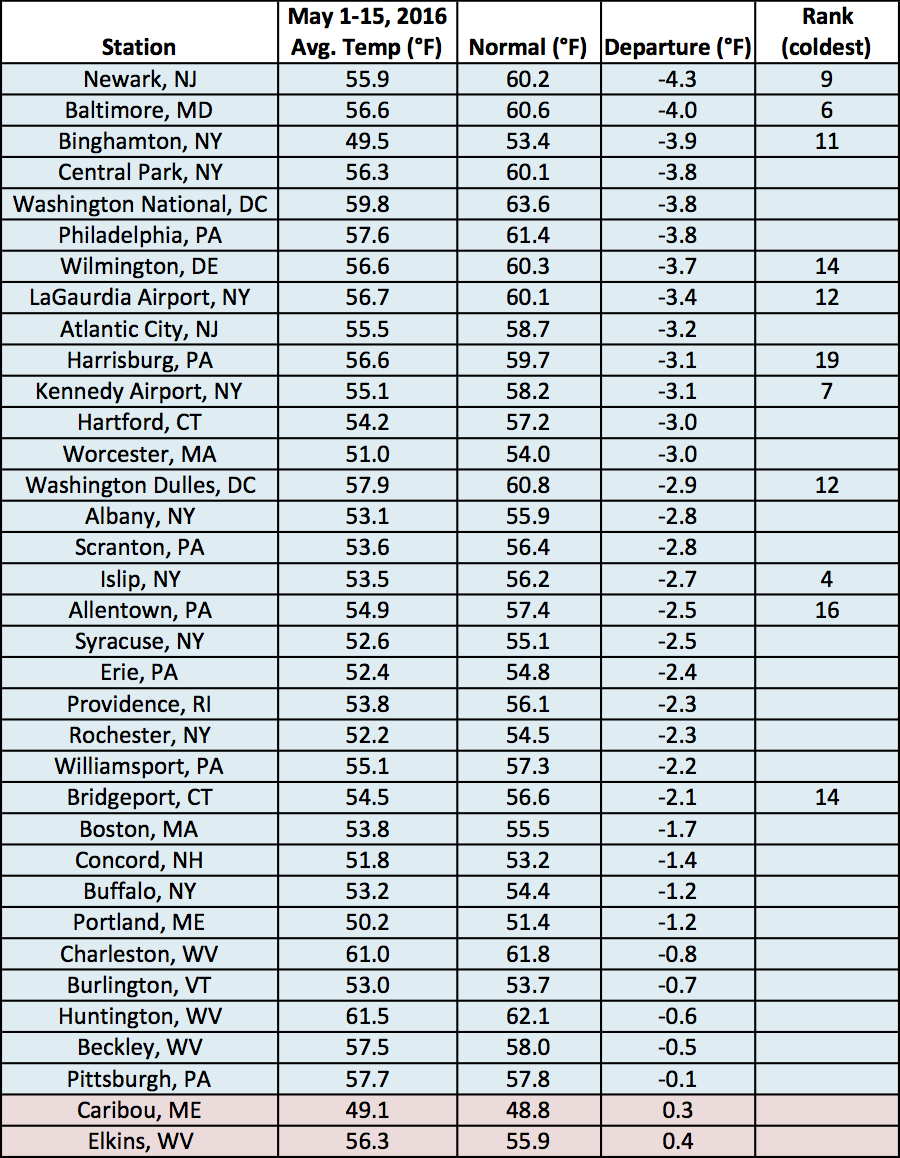
Only two sites saw above-normal temperatures during the May 1-15 period.
A large portion of the Northeast was wetter than normal during the first half of May.
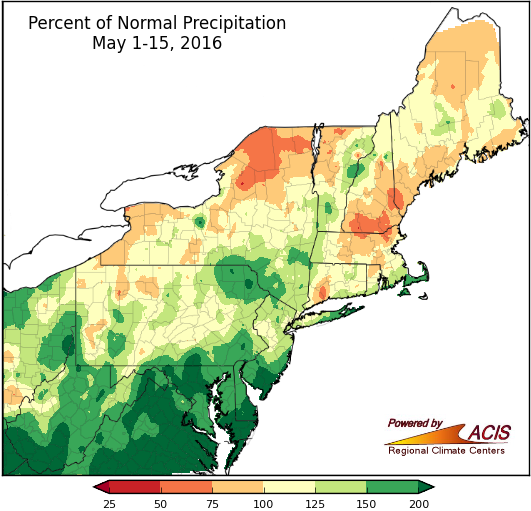
May 1-15 precipitation ranged from 50% of normal in northern New York and parts of New England to more than 200% of normal in parts of West Virginia, Maryland, Delaware, and New Jersey. The wettest areas were stuck in a persistent weather pattern that brought daily precipitation and contributed to below-normal temperatures. The U.S. Drought Monitor showed that the wet conditions helped ease some of the abnormal dryness and moderate drought those areas had been experiencing. Twenty-four of the major climate sites received above-normal precipitation, with twelve of them having a top 20 wettest first half of May.
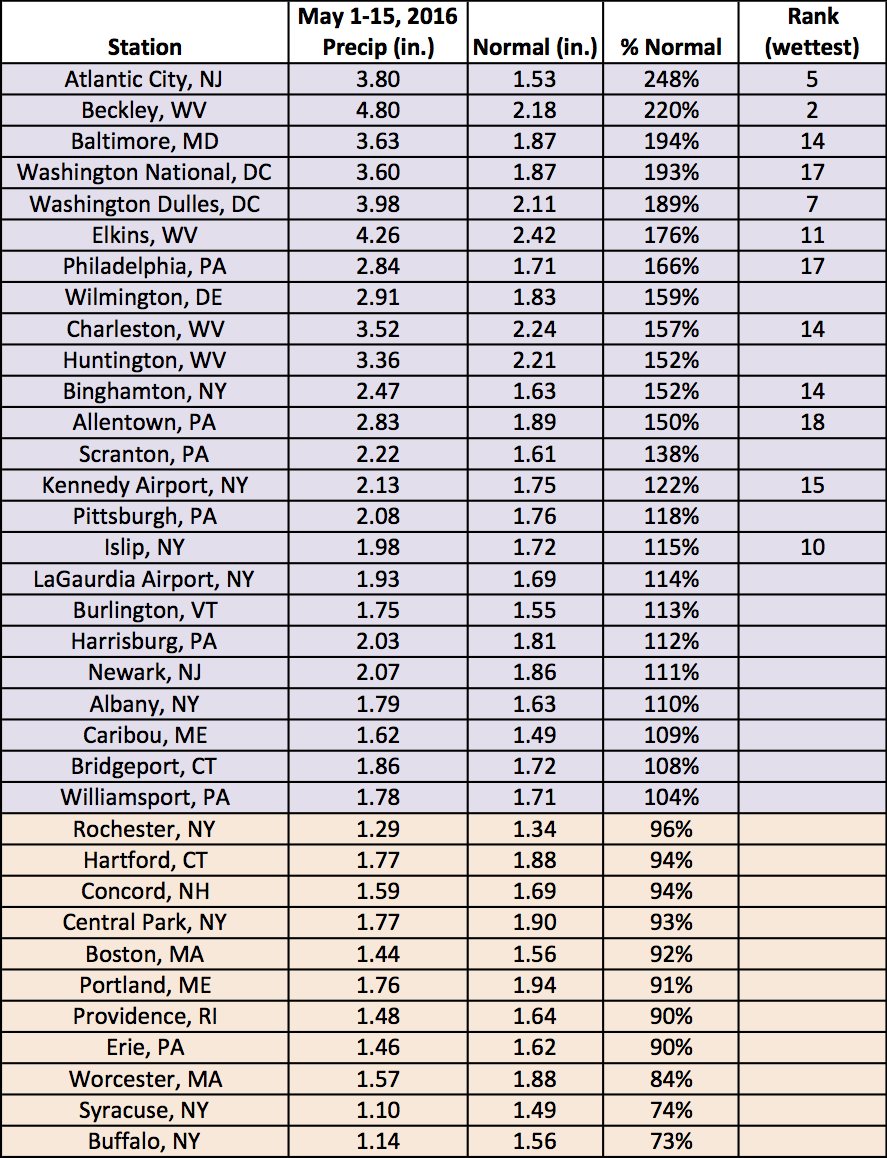
Beckley, WV had its second wettest start to May on record.
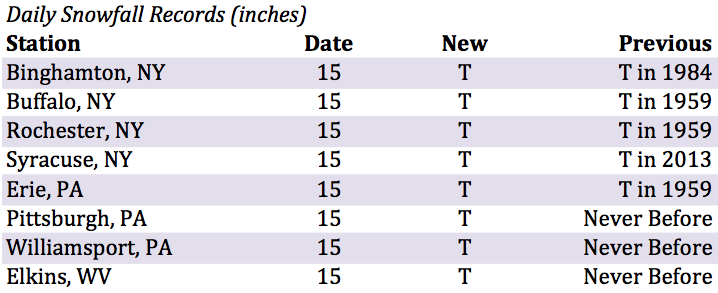
Three sites had not reported snowfall on May 15 until this year.
Eleven major climate sites normally see measurable snow (0.1") during the first half of May. This year, only Caribou, ME did. However, ten other sites saw a trace of snowfall.
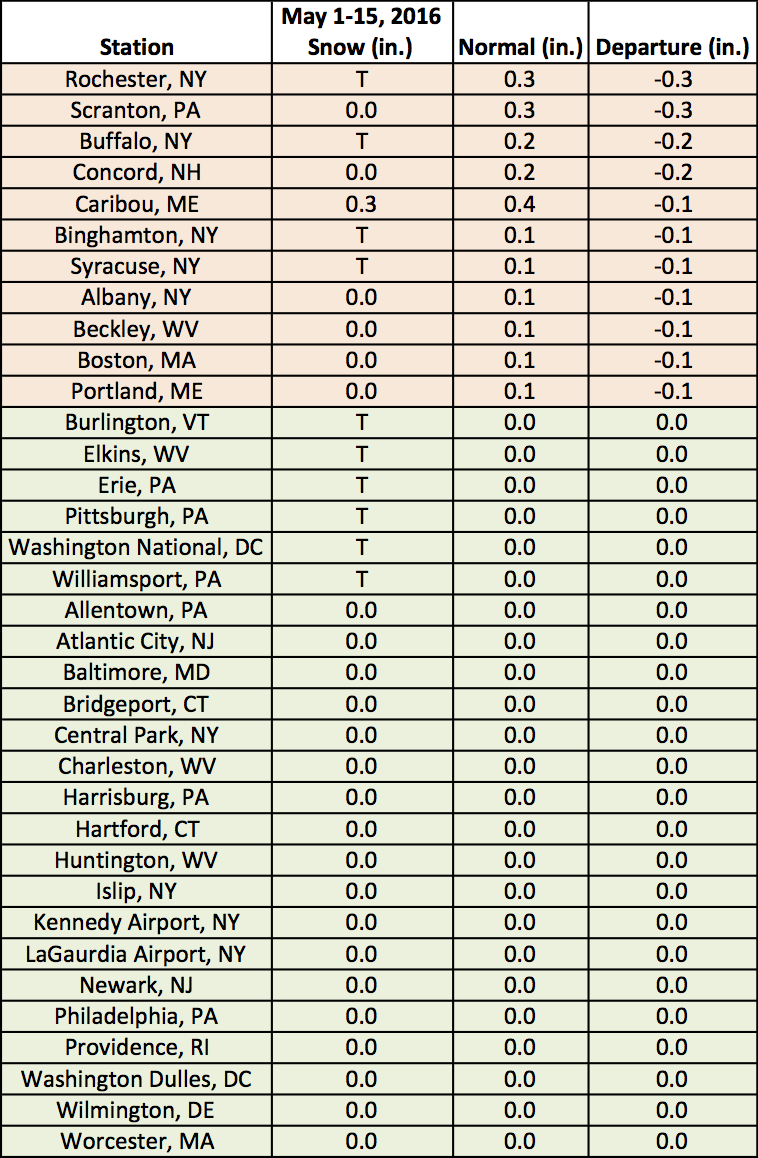
Snowfall was below normal at eleven sites.