Goodbye, 2016!
Much of the Northeast experienced near to above-normal average temperatures in December.
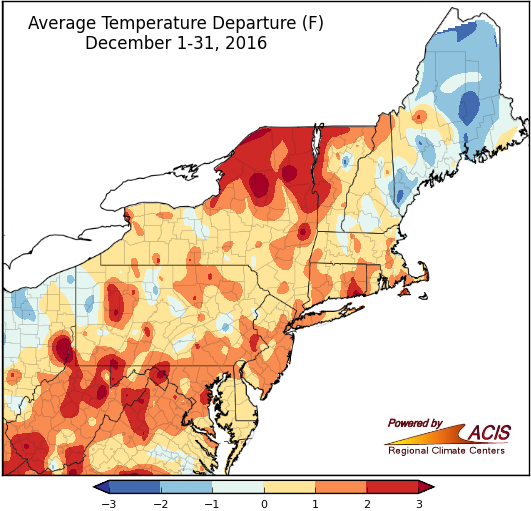
December average temperatures ranged from 3°F below normal to more than 3°F above normal. The coolest spots were in Maine, while the warmest spots were generally in northern New York and portions of West Virginia. Thirty-two of the region’s 35 major climate sites were warmer than normal in December, with five sites ranking the month among their top 20 warmest Decembers.
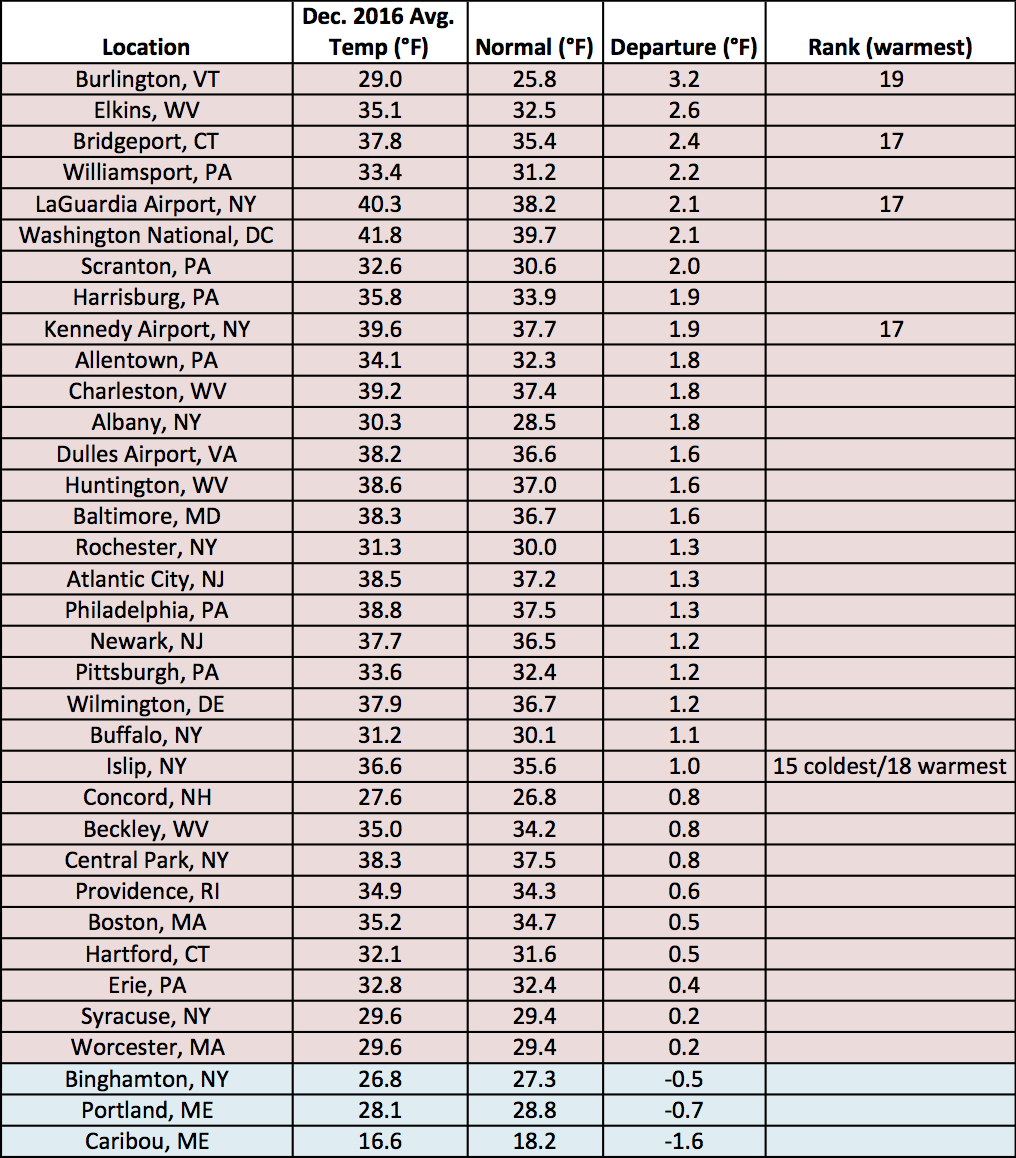
December average temperatures at the major climate sites ranged from 1.6°F below normal in Caribou, ME to 3.2°F above normal in Burlington, VT.
The Northeast was warmer-than-normal in 2016.
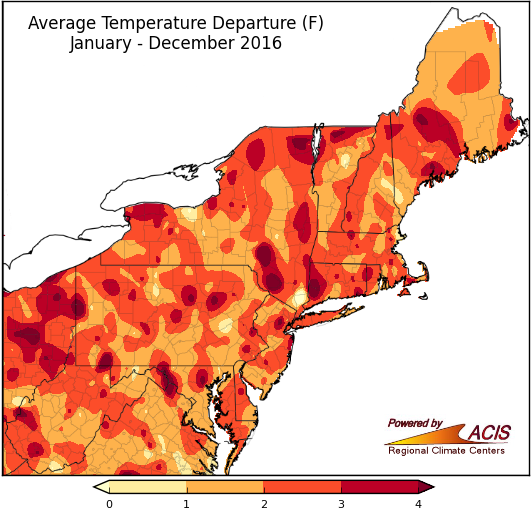
Average temperatures for 2016 ranged from 1°F to more than 4°F above normal for a majority of the region. For the major climate sites, average temperatures in 2016 ranged from 1.4°F above normal in Syracuse, NY to 3.4°F above normal in Burlington, VT. All of the sites ranked 2016 among their top 20 warmest years on record, with LaGuardia Airport, NY and Concord, NH being record warm.
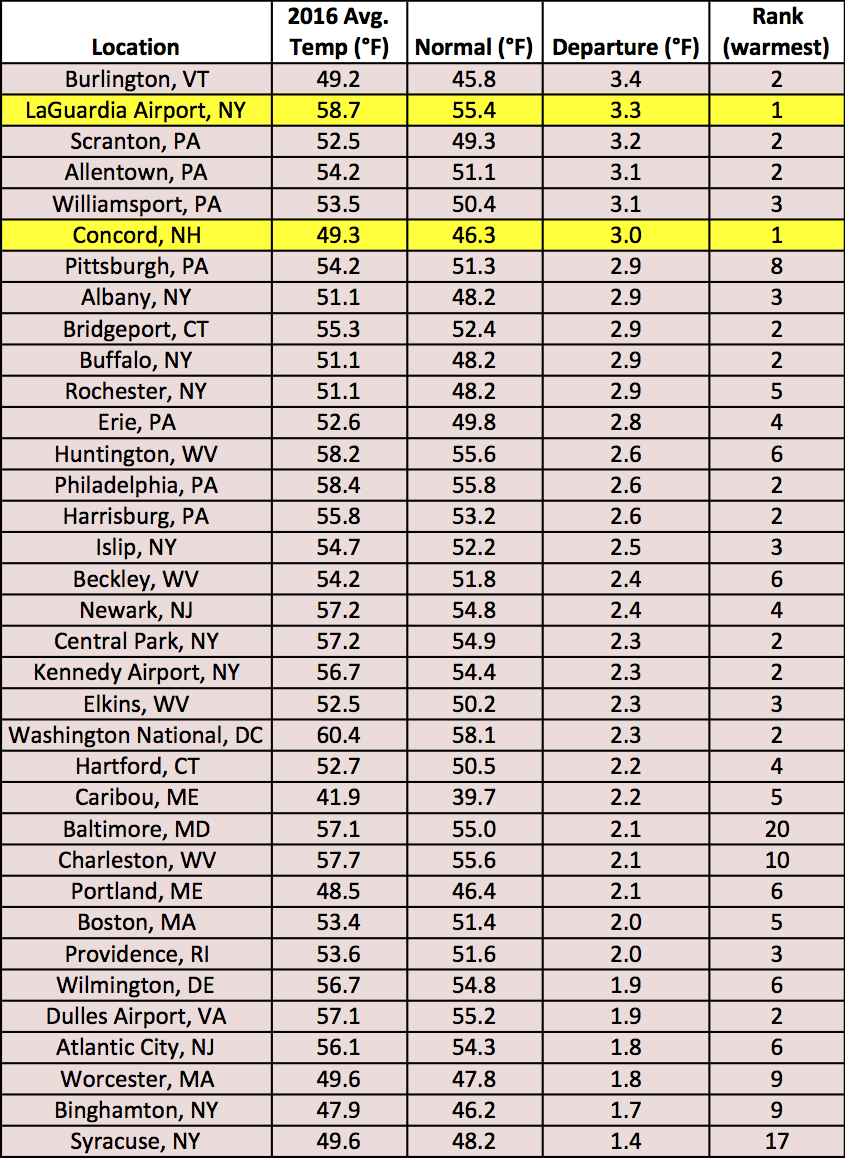
Thirty-three sites ranked 2016 among their top 10 warmest years on record.
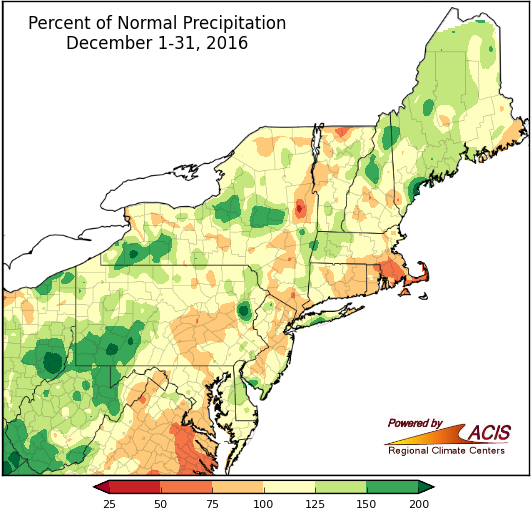
A large portion of the Northeast saw near to above-normal precipitation in December.
December precipitation ranged from 50% to 200% of normal for much of the Northeast. The driest area was southeastern Massachusetts, while the wettest areas were scattered throughout the region. Twenty major climate sites were drier than normal in December, while fifteen were wetter than normal. Drought conditions lingered across portions of the region in December.
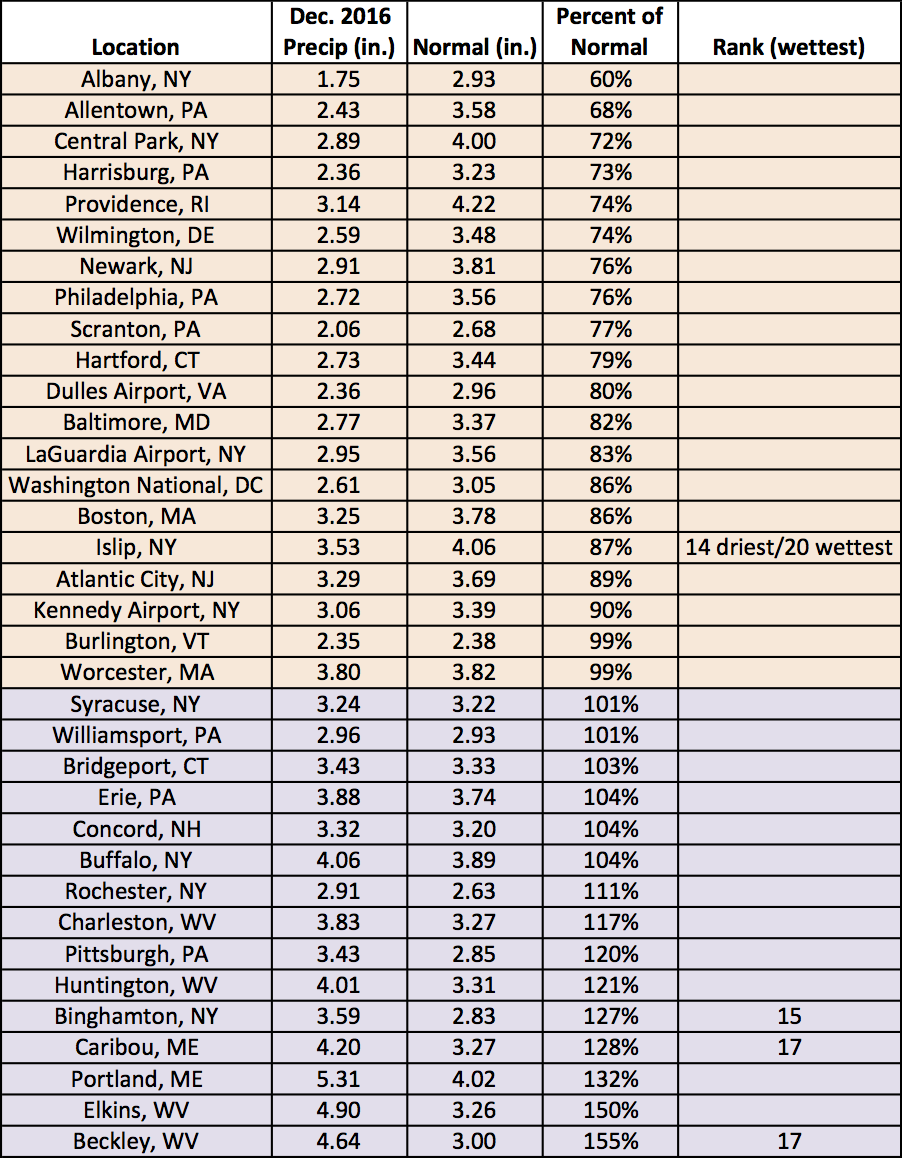
December precipitation at the major climate sites ranged from 60% of normal in Albany, NY to 155% of normal in Beckley, WV.
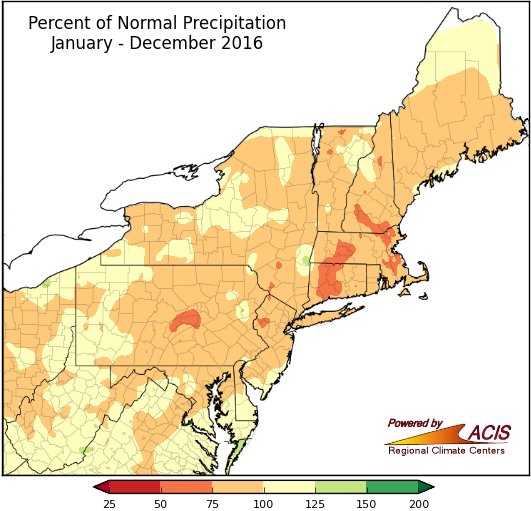
Most areas received 75% to 125% of normal precipitation in 2016.
For 2016, precipitation ranged from 50% to 125% of normal in the Northeast. The driest areas were generally in New England and central Pennsylvania. Of the twenty-eight major climate sites that were drier than normal in 2016, ten ranked this year among their top 20 driest. Conversely, of the seven wetter-than-normal sites, two ranked this year among their top 20 wettest.
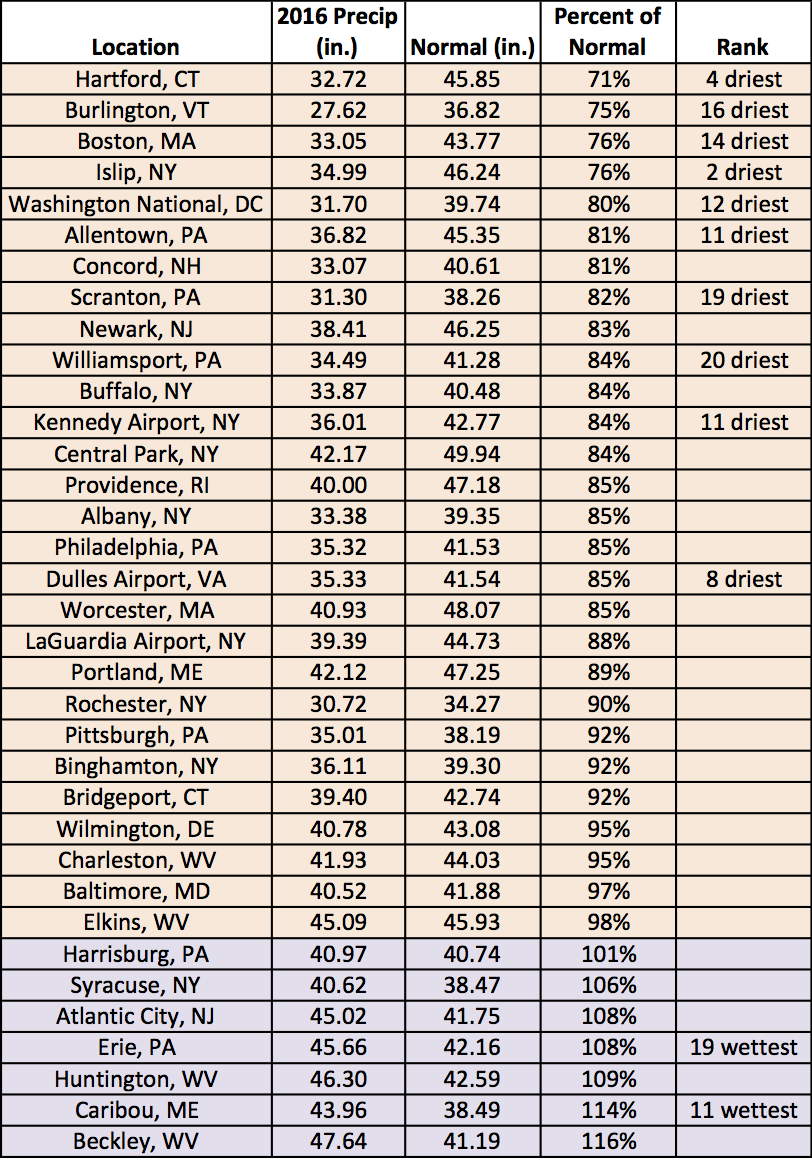
2016 precipitation at the major climate sites ranged from 71% of normal in Hartford, CT to 116% of normal in Beckley, WV.
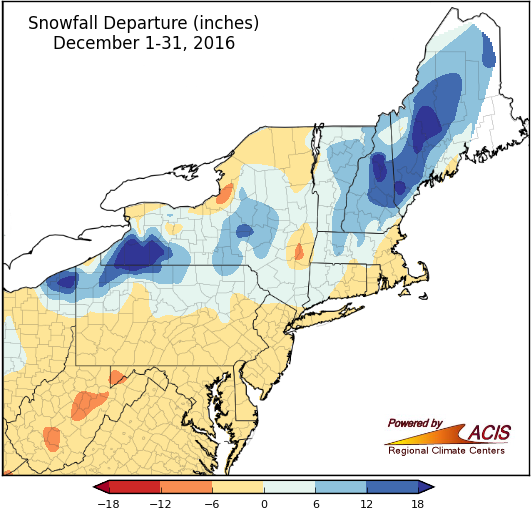
Southern parts of the region tended to see near to below normal snowfall in December, while northern areas tended to see near to above normal snowfall.
Snowfall in December ranged from 12 inches below normal to more than 18 inches above normal. The least snowy spots were generally in West Virginia and western Maryland, while the snowiest spots were in southwestern New York and northern New England. Twenty-three of the major climate sites received below-normal snowfall, with two ranking the month among their top 20 least snowy Decembers on record. Of the eleven sites that received above-normal snowfall, four ranked it among their top 20 snowiest Decembers.
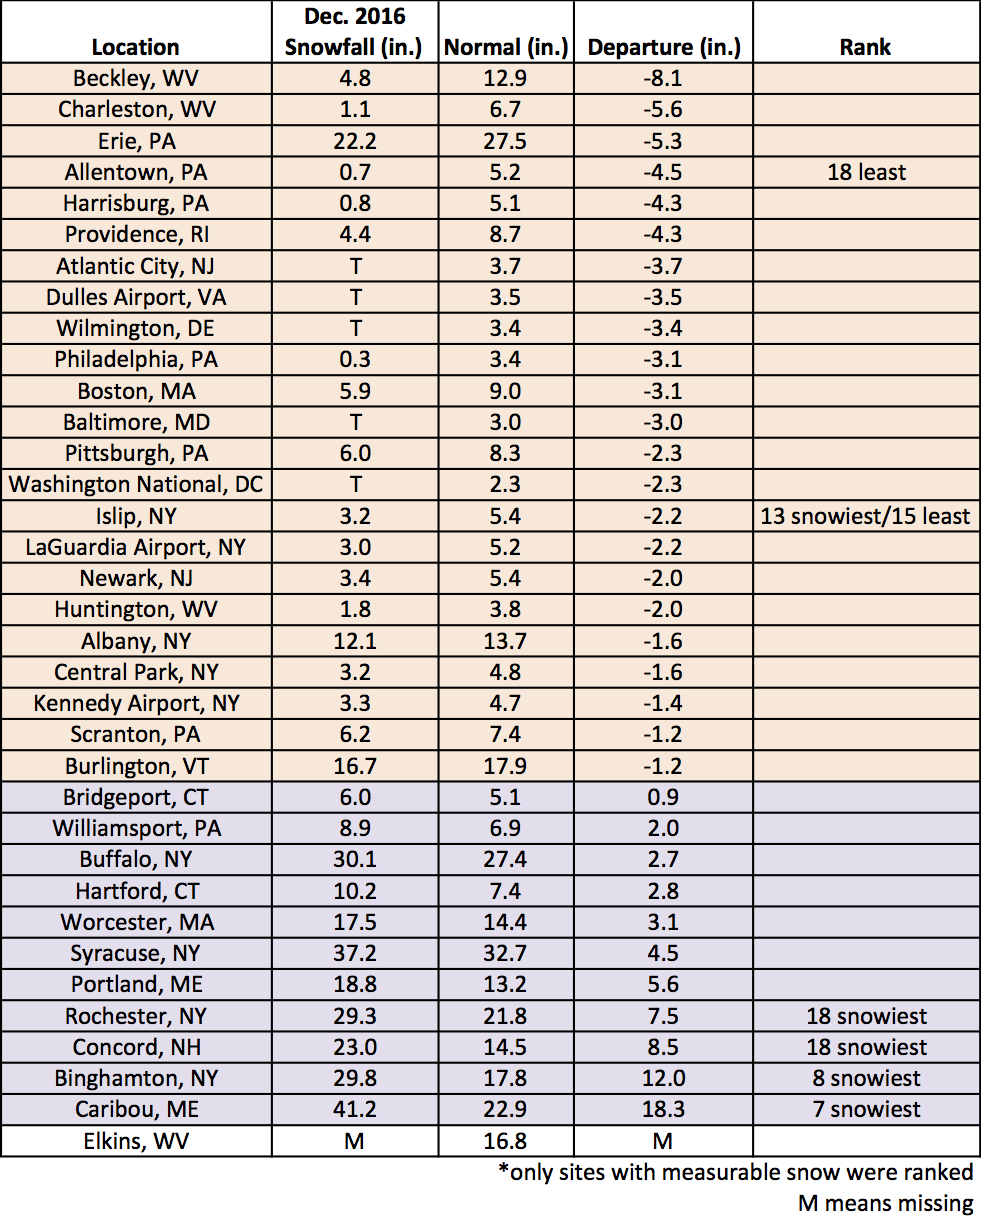
December snowfall ranged from 8.1 inches below normal in Beckley, WV to 18.3 inches above normal in Caribou, ME.