Mid-January - Spanning the Spectrum
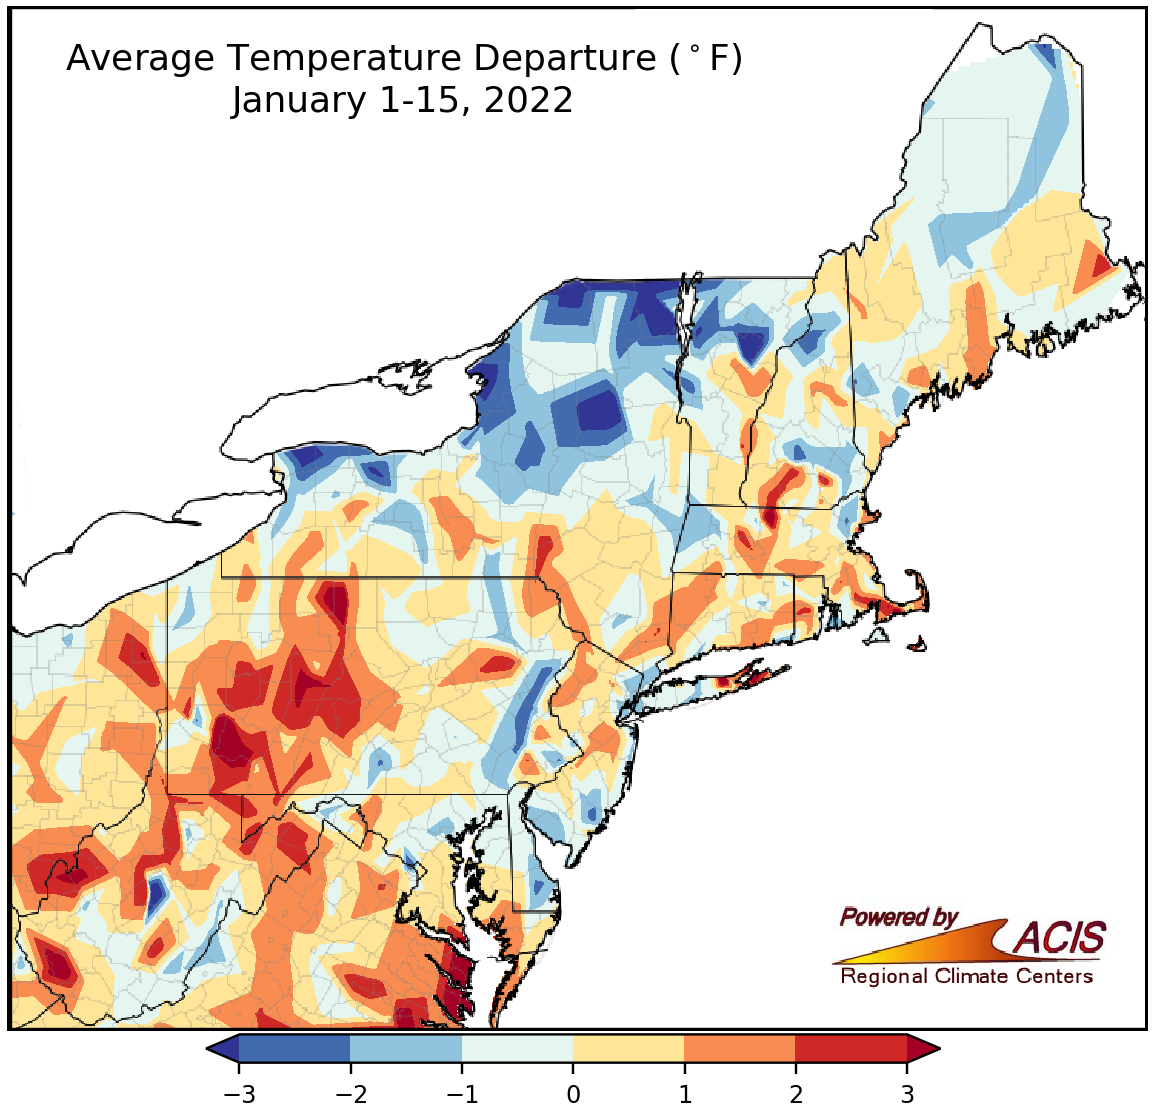
January 1-15 average temperatures ranged from more than 3°F below normal to more than 3°F above normal.
Average temperatues during the first half of January ranged from more than 3°F colder than normal in places such as northern New York to more than 3°F warmer than normal in areas such as southwestern Pennsylvania. January 1-15 average temperatures at the 35 major climate sites ranged from 3.5°F below normal in Rochester, NY, to 1.3°F above normal in Elkins, WV, with 30 of the sites being colder than normal.
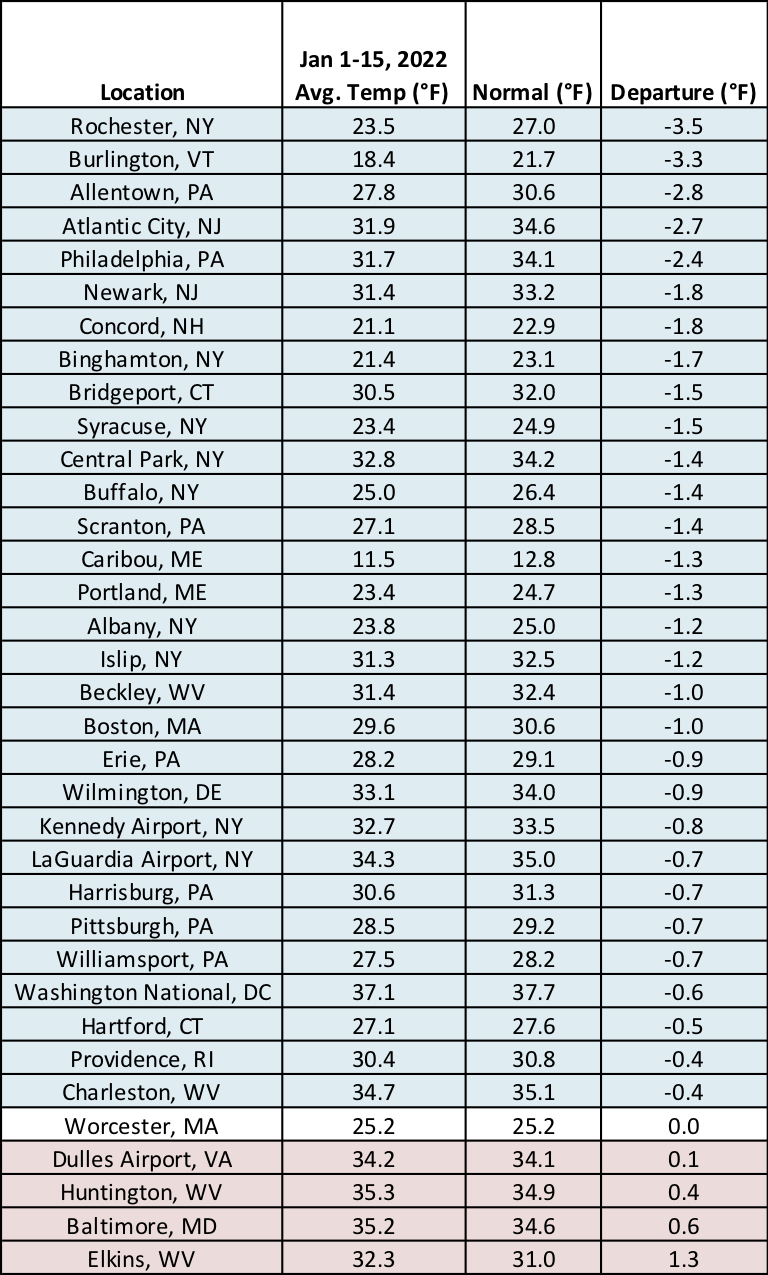
Thirty of the 35 major climate sites were colder than normal during the January 1-15 period.
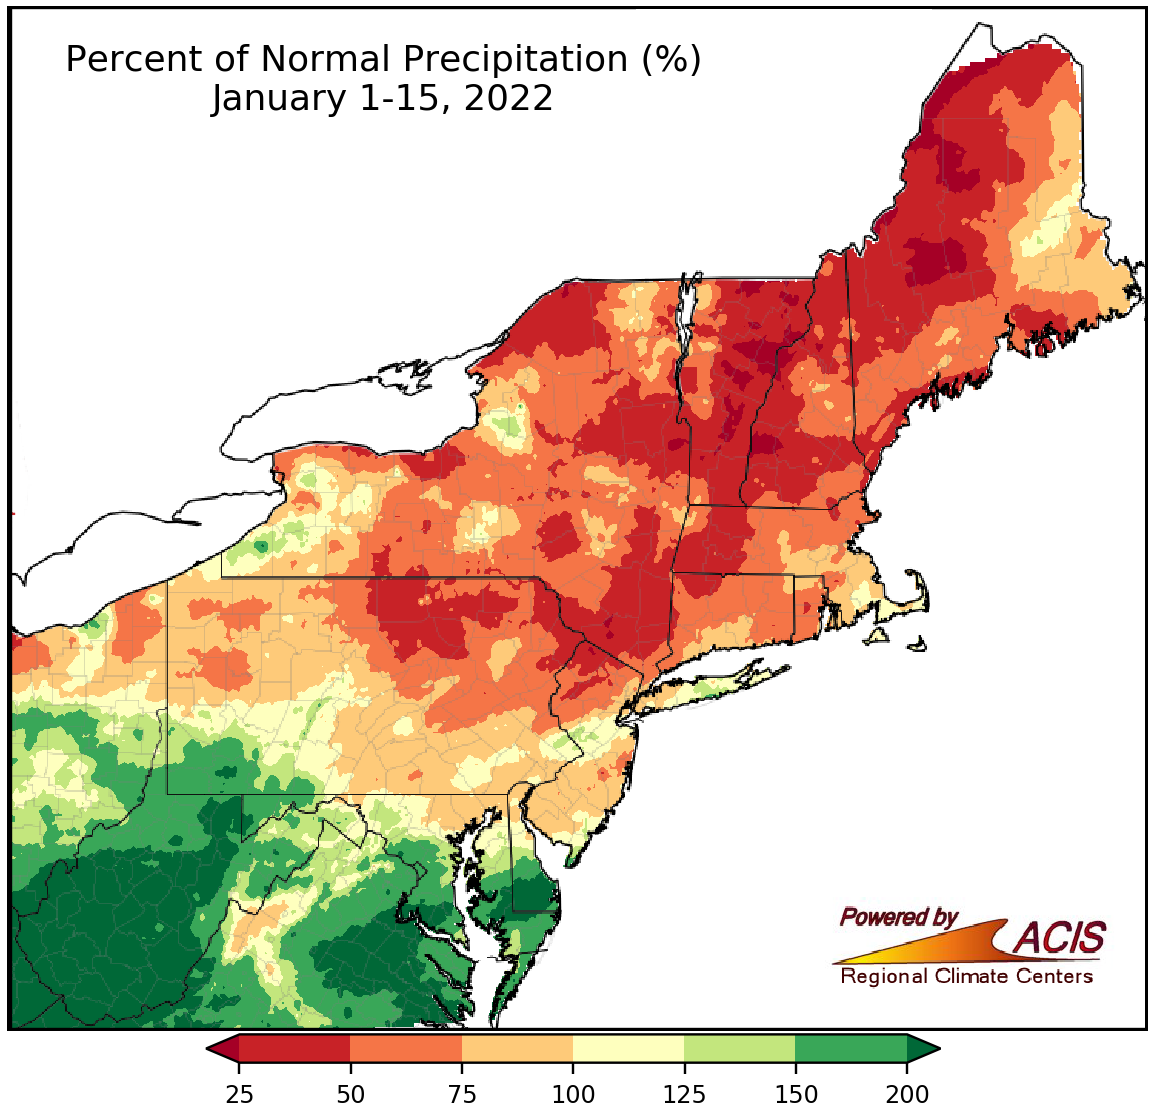
January 1-15 precipitation ranged from less than 25% of normal to more than 200% of normal.
The first half of January was drier than normal for northern areas, with the driest locations in northern New England seeing less than 25% of normal precipitation. Conversely, southern locations were wetter than normal, with the wettest areas seeing more than 200% of normal precipitation. January 1-15 precipitation at the 35 major climate sites ranged from 27% of normal in Burlington, VT, to 266% of normal in Charleston, WV, with 22 of the sites being drier than normal. This January 1-15 period ranked among the 20 driest on record for three major climate sites but among the 20 wettest on record for six other sites.
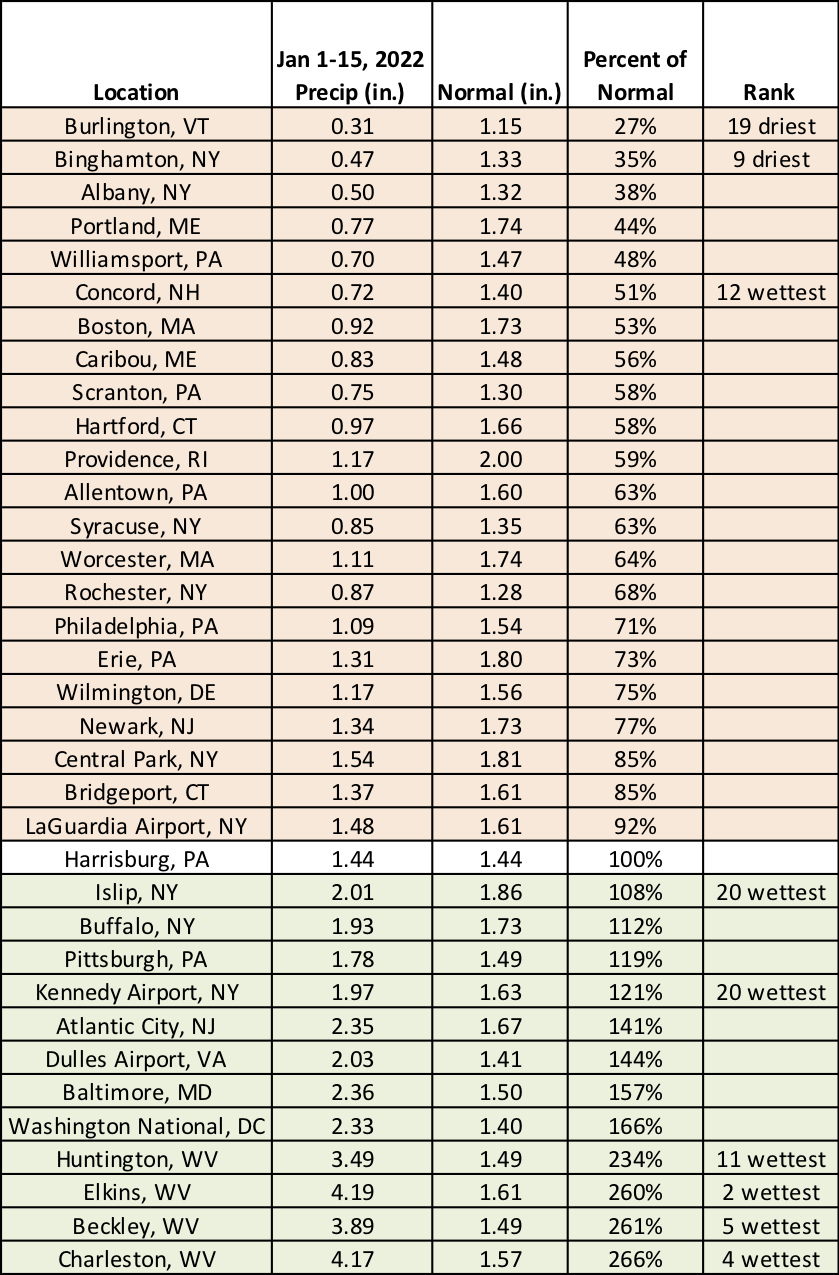
This January 1-15 period was among the 20 driest on record for three major climate sites but among the 20 wettest for six other sites.
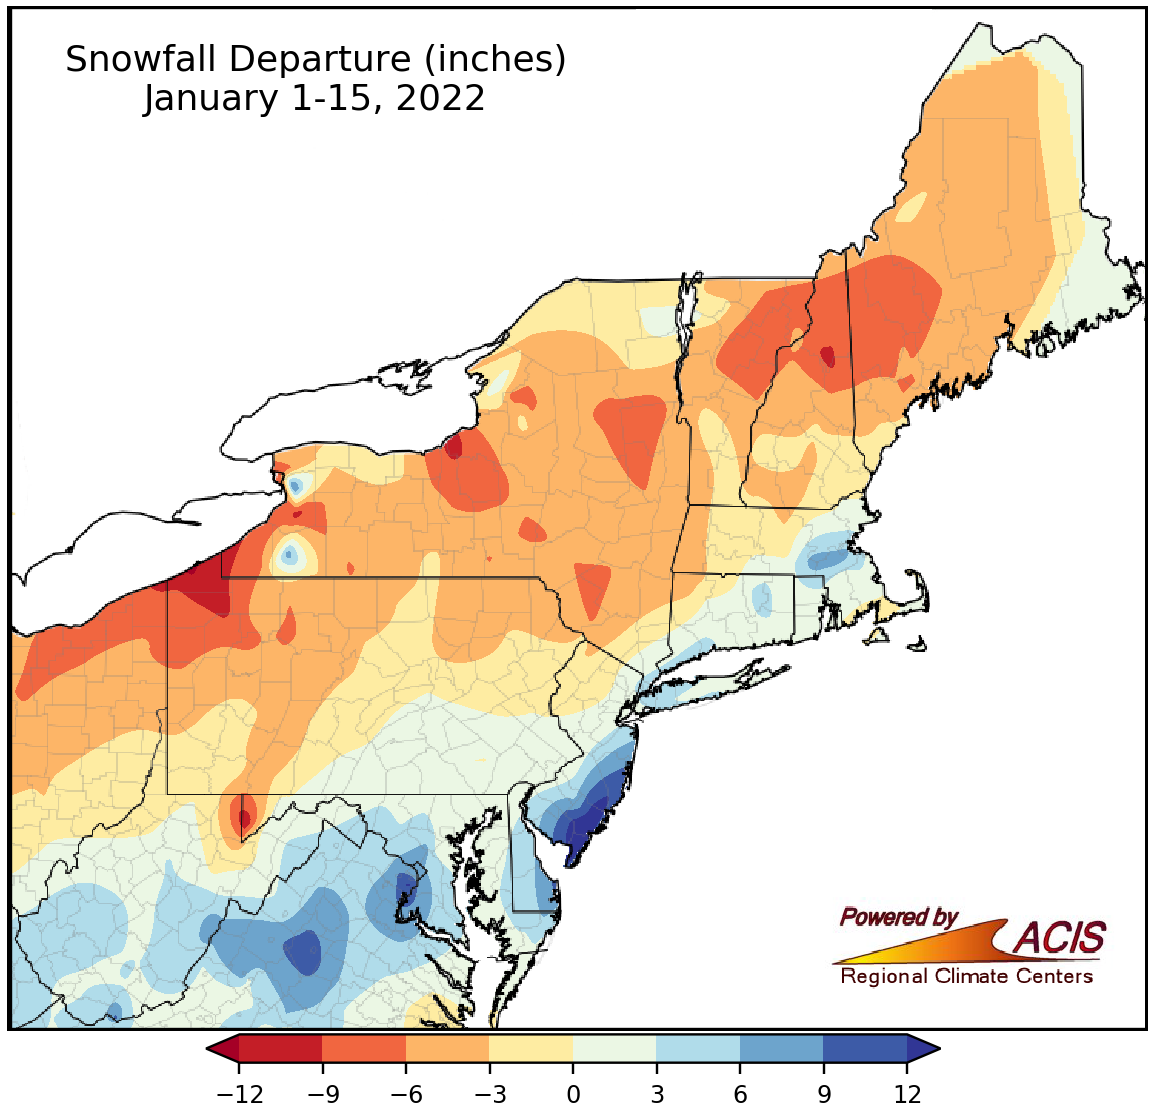
January 1-15 snowfall ranged from 12 inches below normal to more than 12 inches above normal.
The general snowfall pattern during the first half of January was similar to the precipitation pattern - below normal in northern areas and above normal in southern areas. Snowfall ranged from 12 inches below normal in northwestern Pennsylvania to more than 12 inches above normal in southern New Jersey. January 1-15 snowfall at the 35 major climate sites ranged from 12.6 inches below normal in Erie, PA, to 14.6 inches above normal in Atlantic City, NJ, its snowiest first half of January on record. The major climate sites were almost evenly split, with 17 seeing below-normal snowfall and 18 seeing above-normal snowfall. This January 1-15 period ranked as the ninth least snowy on record for Binghamton, NY, but among the 20 snowiest on record for 13 of the major climate sites.
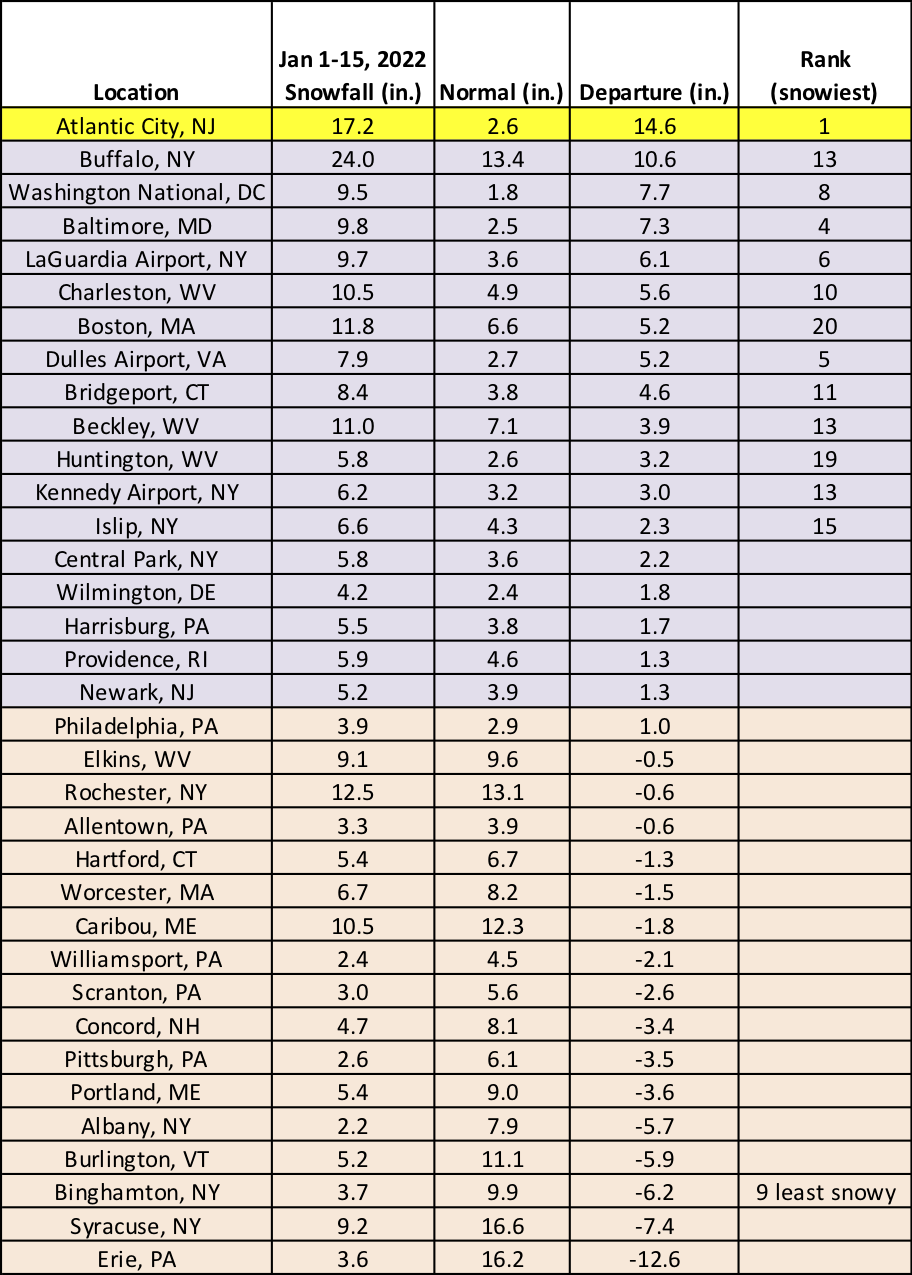
This January 1-15 period was the snowiest on record for Atlantic City, NJ, and among the 20 snowiest for another 12 major climate sites. However, Binghamton, NY, had its ninth least snowy start to January.
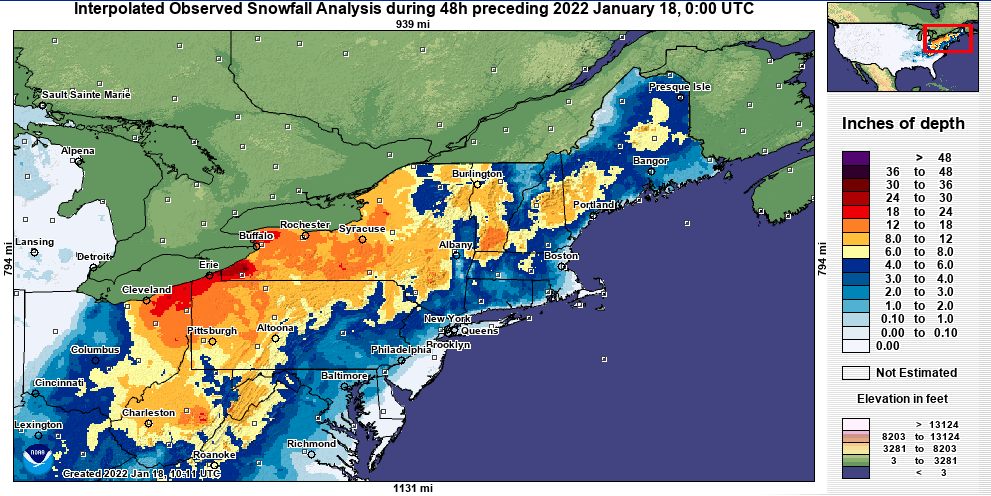
Snow totals from the January 16-17 storm, with the highest amounts of up to 24 inches shaded red. Credit: NOHRSC. Click to enlarge.
A major winter storm dropped snow on much of the Northeast on January 16 and 17, with the greatest storm snow totals of 18 to 24 inches in western New York and northwestern Pennsylvania. Buffalo, NY’s 17.6 inches of snow on January 17 made it the site’s third snowiest January day, while Erie, PA’s 13.6 inches qualified as the site’s second snowiest January day. Buffalo had just recorded its second snowiest January day earlier in the month and is on track to have one of its 10 snowiest Januaries on record. The snowfall from the storm propelled some sites, such as Erie, from below-normal January-to-date snowfall to above normal.
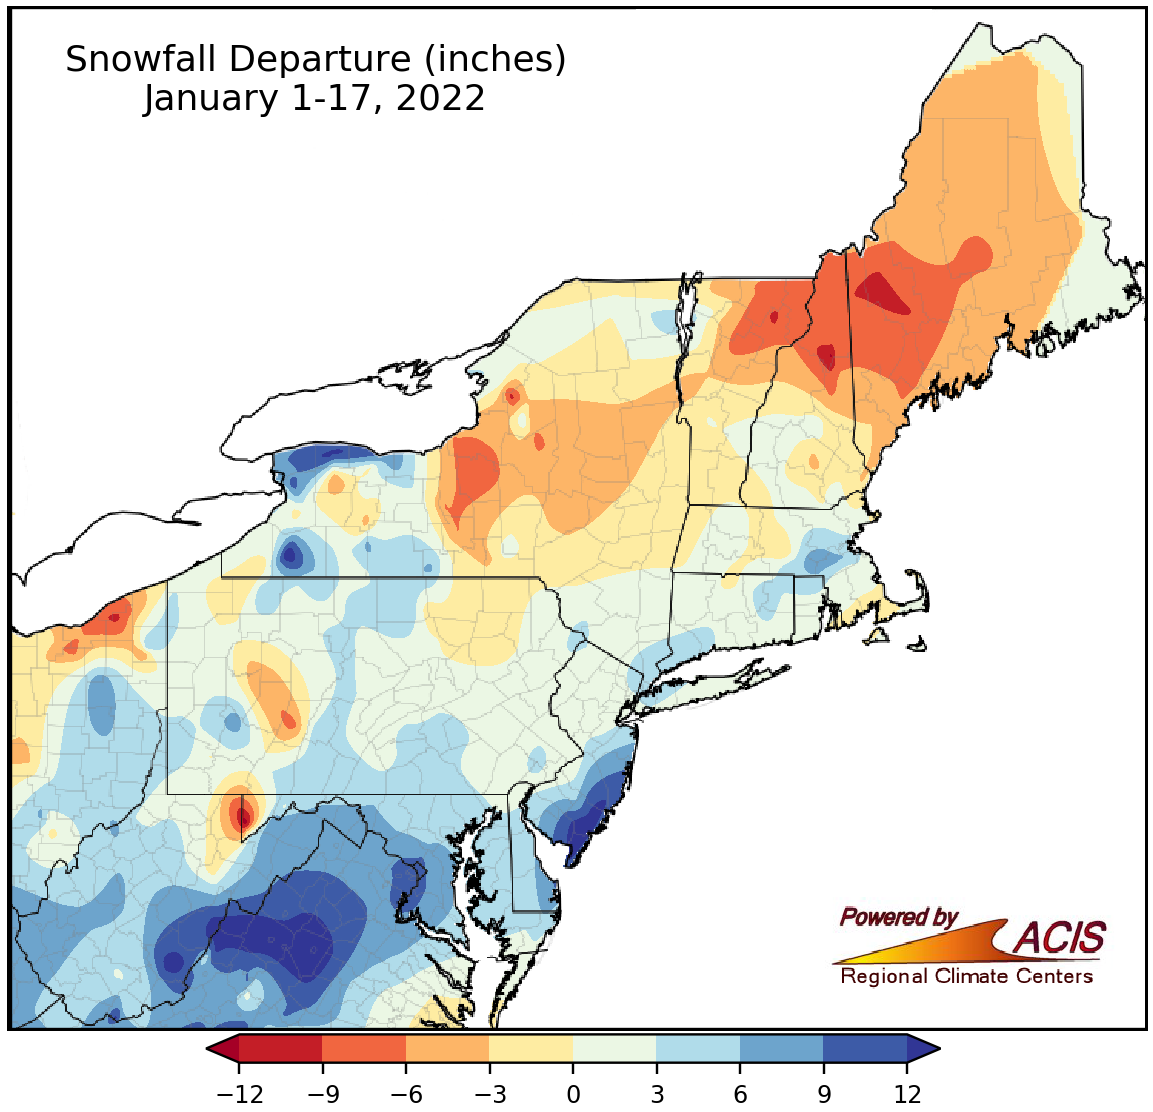
The January 1-17 snowfall map, which includes the recent storm, shows more sites with above-normal snowfall for the January-to-date period.