A Cold, Snowy February Wraps Up a Warm Winter
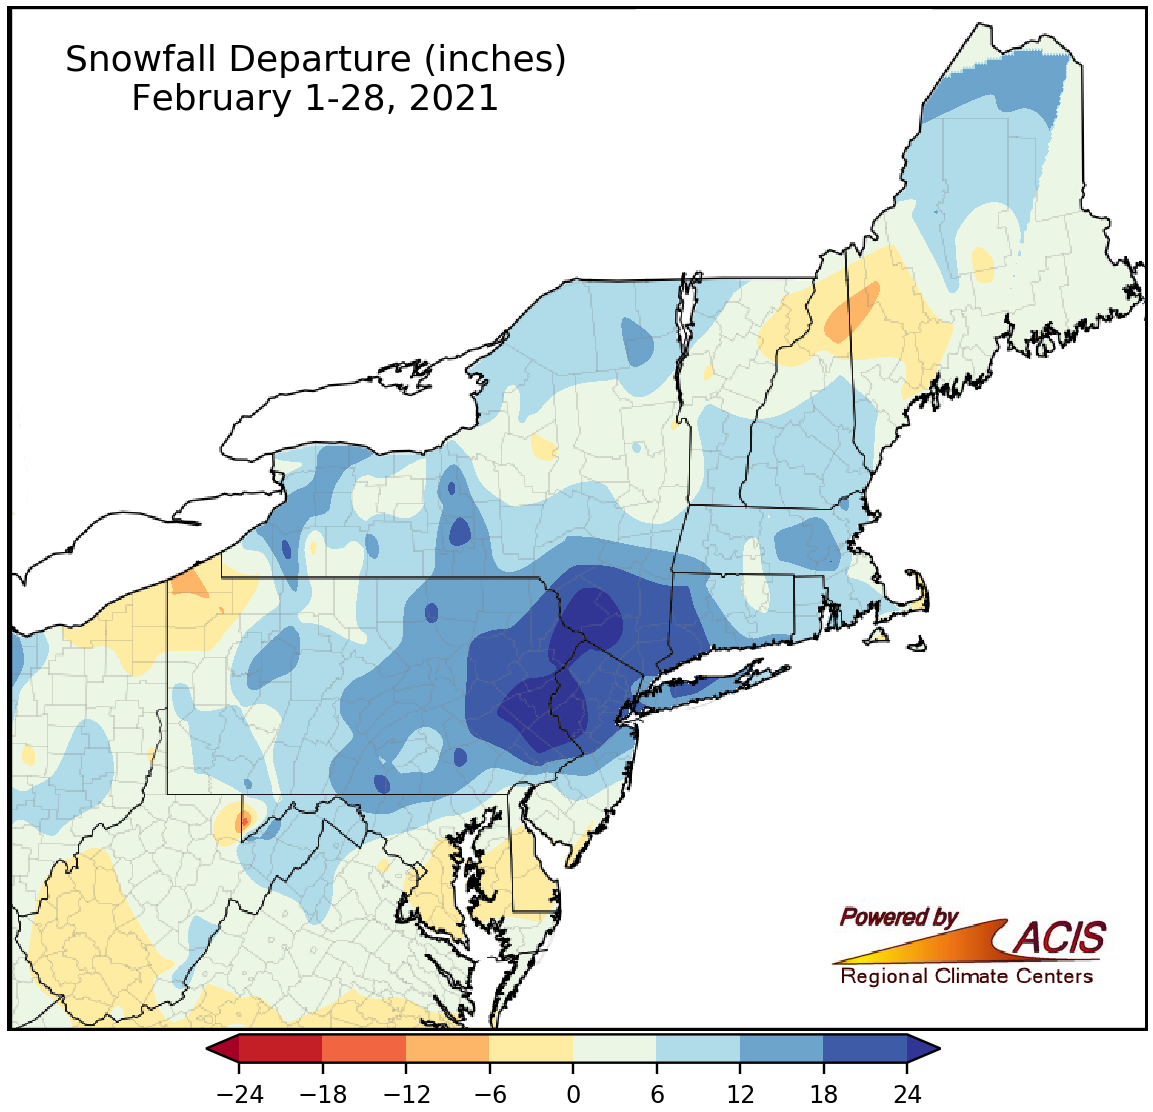
February snowfall ranged from 12 inches below normal to more than 24 inches above normal.
February was snowier than normal for much of the Northeast, with the largest surplus of more than 24 inches in portions of eastern Pennsylvania, northern New Jersey, and southeastern New York. However, a few areas saw snowfall deficits of up to 6 inches. Twenty-six major climate sites saw above-normal snowfall, with 17 of them ranking this February among their 20 snowiest on record. Overall, February snowfall at the major climate sites ranged from 7.0 inches below normal in Erie, PA, to 28.5 inches above normal in Allentown, PA.
With frequent storms during the month, several major climate sites, particularly southern and coastal locations, saw an unusually high number of days with measurable snow, ranking among the ten greatest for February or on record. For instance, Baltimore, MD, had nine days with measurable snow during February, tying as the second greatest number for any month on record. Similarly, Pittsburgh, PA, had 16 days with measurable snow, which tied as the second greatest number for any February on record.
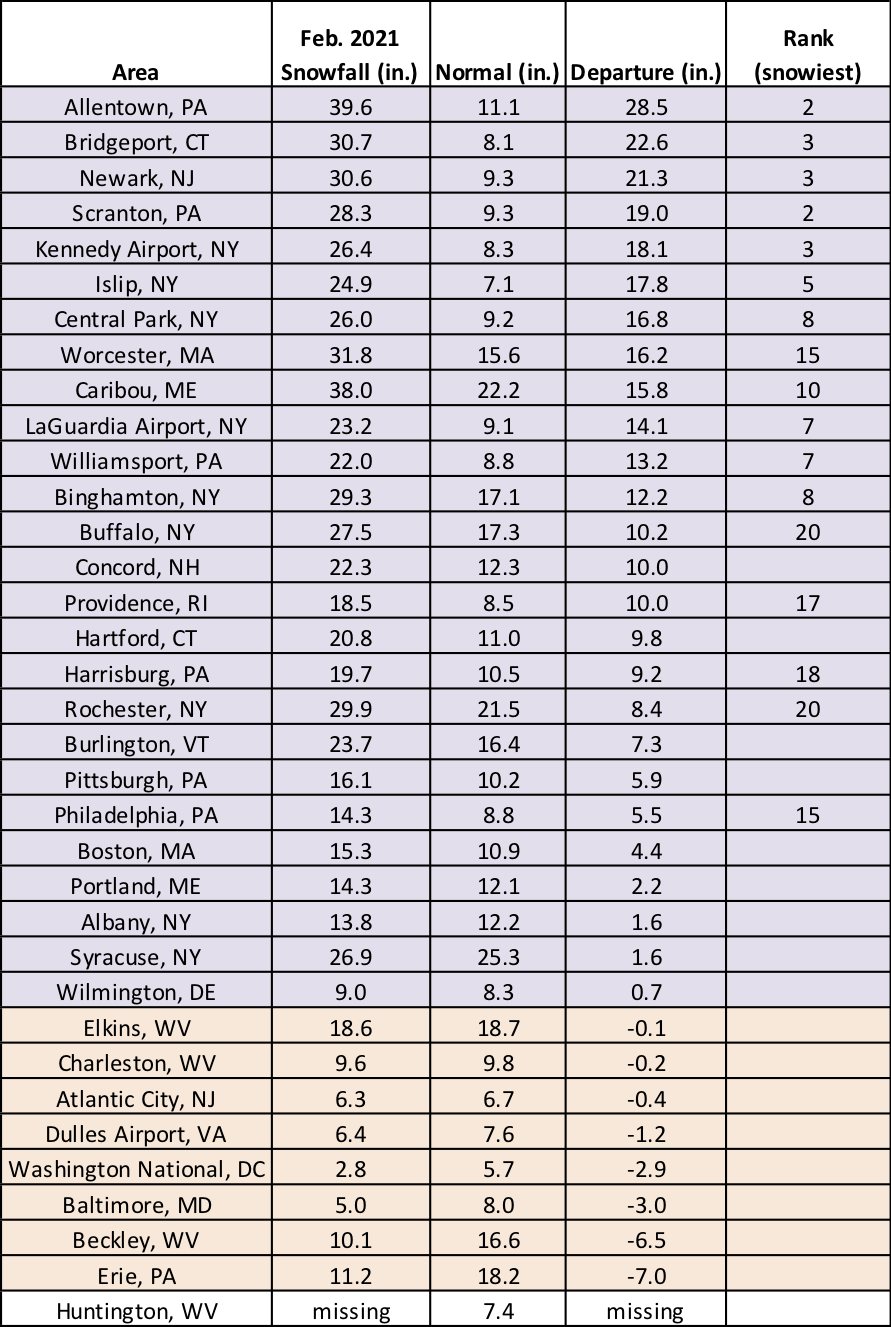
This February was among the 20 snowiest on record at 17 major climate sites.
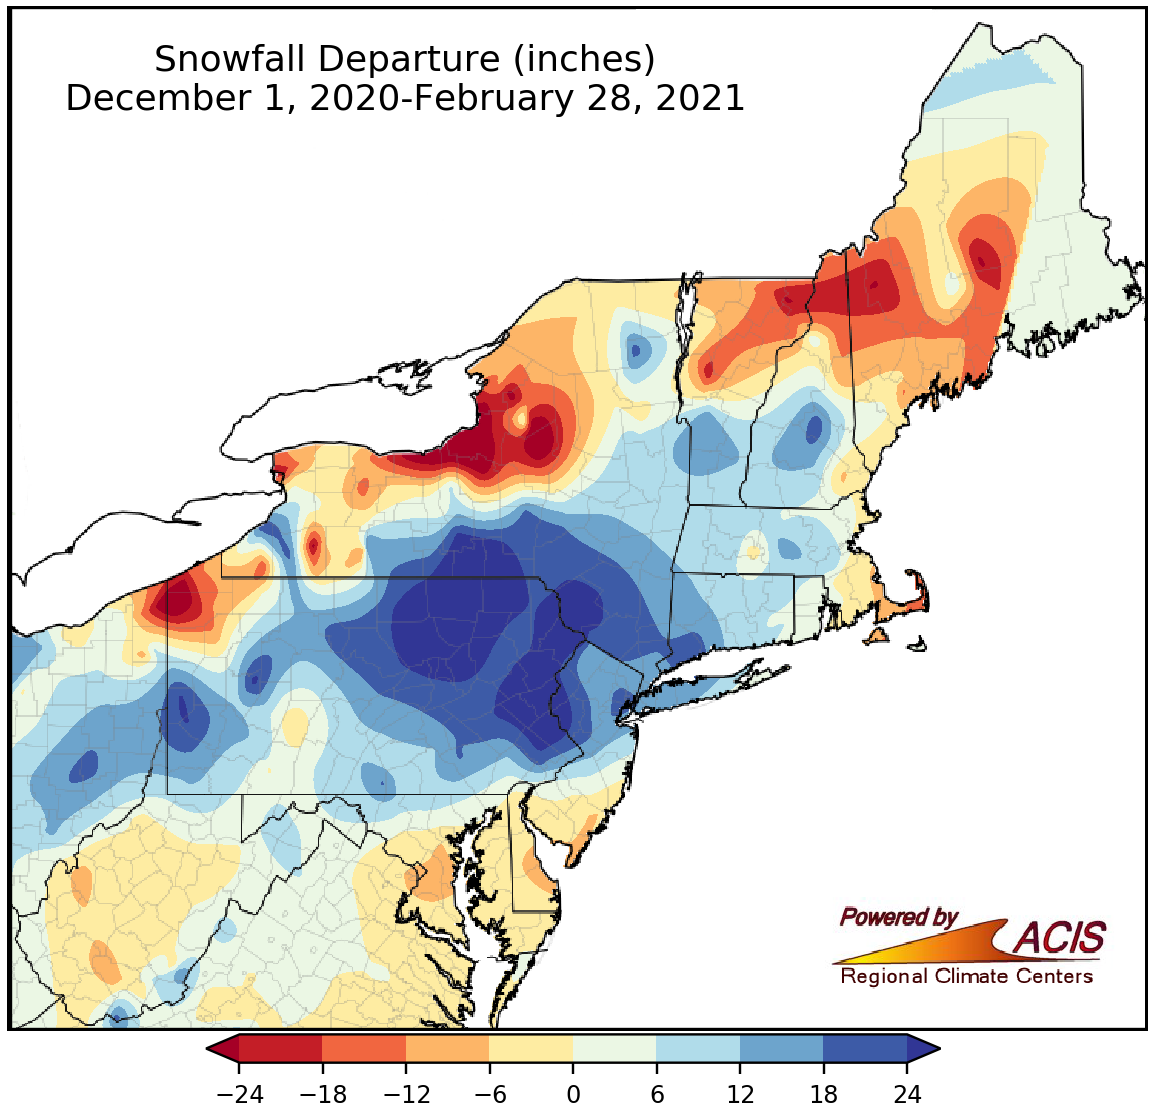
Winter snowfall ranged from more than 24 inches below normal to more than 24 inches above normal.
Winter snowfall varied, ranging from more than 24 inches below normal in lake-effect areas of New York and Pennsylvania to more than 24 inches above normal with portions of central New York and northern and eastern Pennsylvania that saw several notable snowstorms. Snowfall departures at the major climate sites ranged from 29.2 inches below normal in Syracuse, NY, to 37.2 inches above normal in Binghamton, NY, which saw its snowiest winter on record. In fact, of the 22 snowier-than-normal climate sites, 12 (including Binghamton) ranked this winter among their 20 snowiest on record.
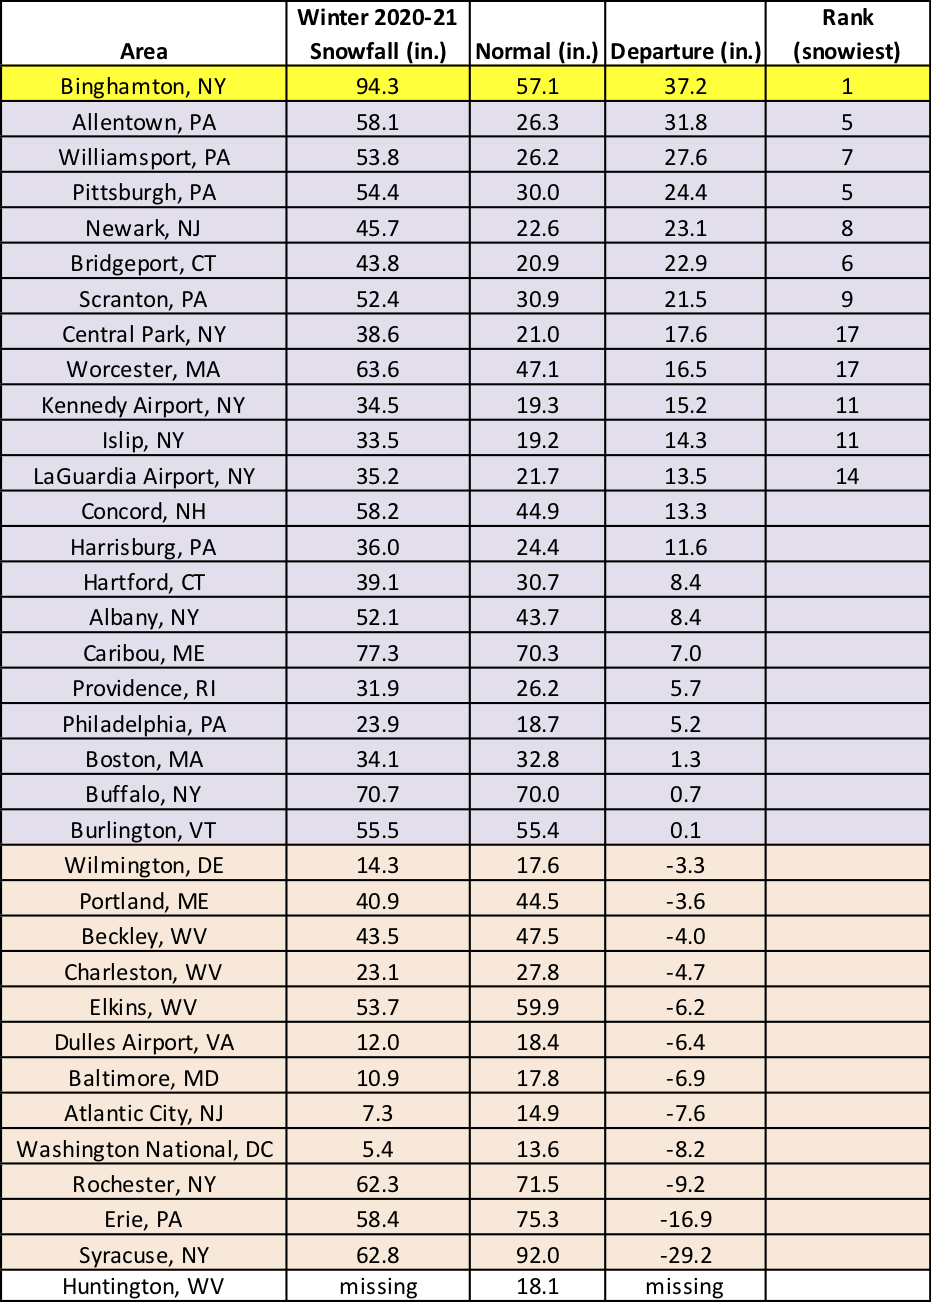
Binghamton, NY, had its snowiest winter on record, while another 11 major climate sites had one of their 20 snowiest winters on record.
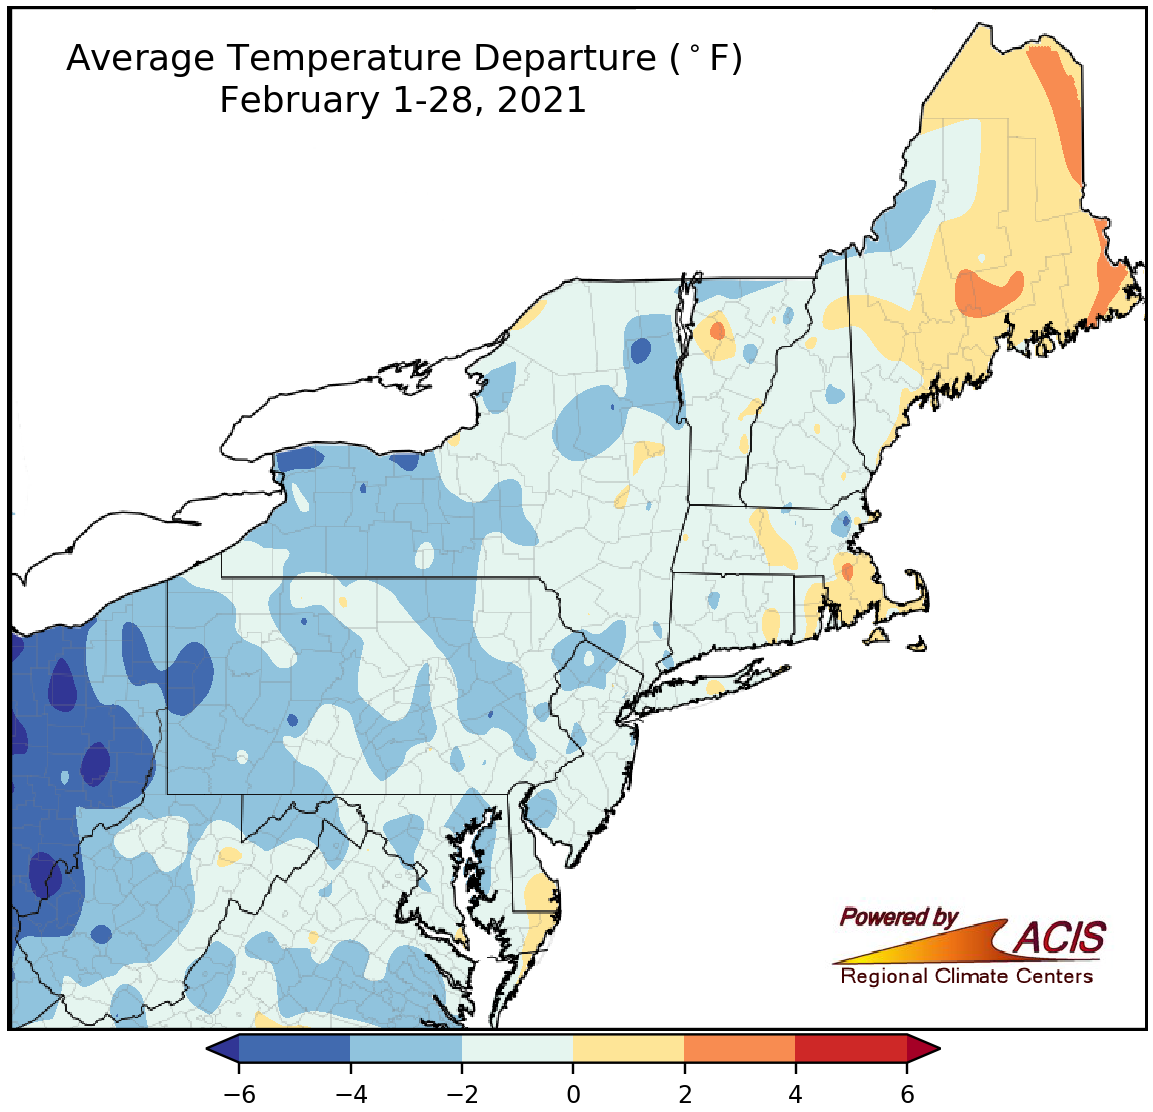
February average temperatures ranged from 6°F below normal to 4°F above normal.
A majority of the Northeast experienced a colder-than-normal February, with average temperatures ranging from 6°F below normal to near normal. However, some locations, particularly in New England, were as much as 4°F warmer than normal. February average temperatures at the 35 major climate sites ranged from 4.6°F below normal in Huntington, WV, to 2.2°F in Caribou, ME, which had its 20th warmest February on record. Overall, 28 major climate sites were colder than normal.
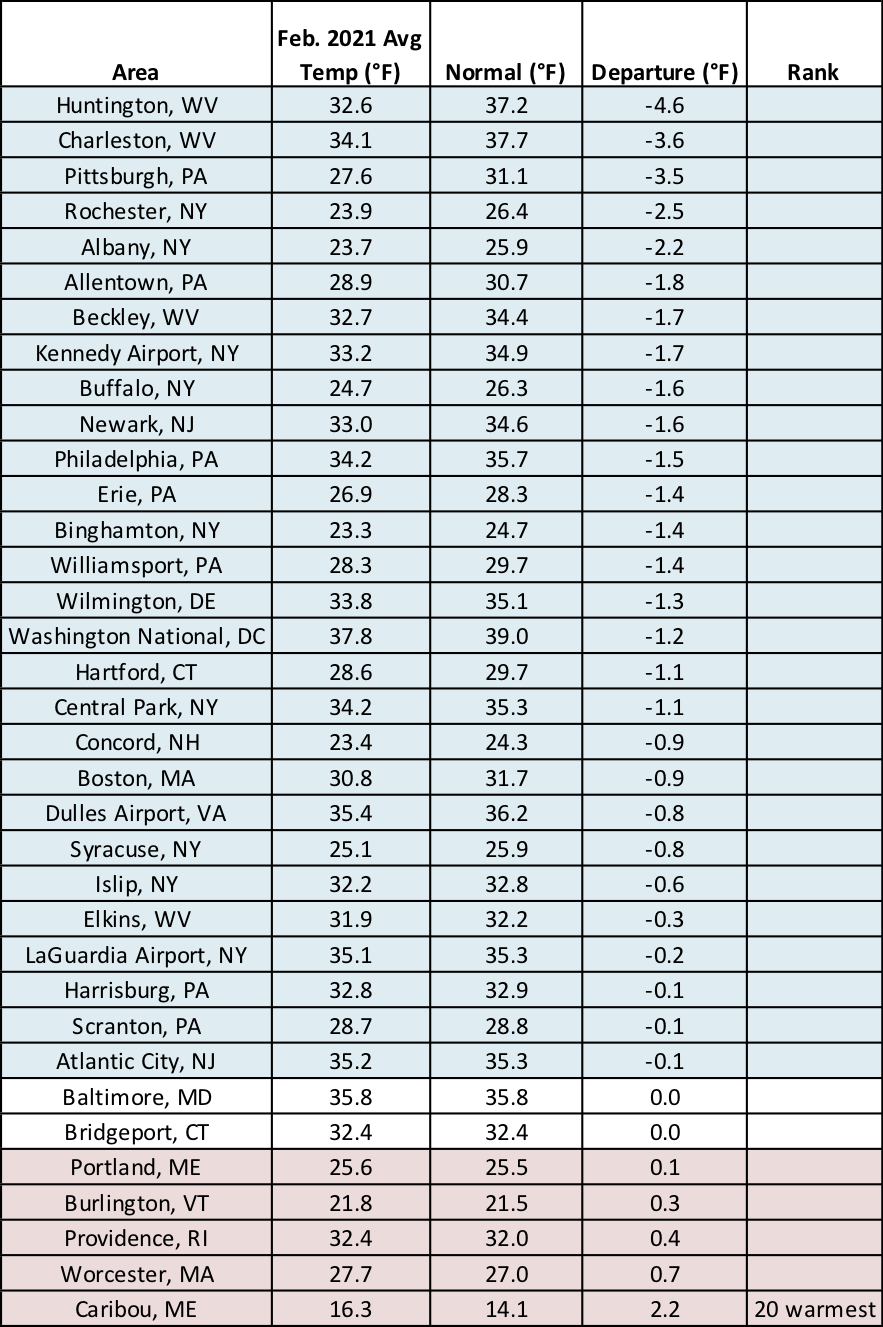
Twenty-eight major climate sites experienced a colder-than-normal February.
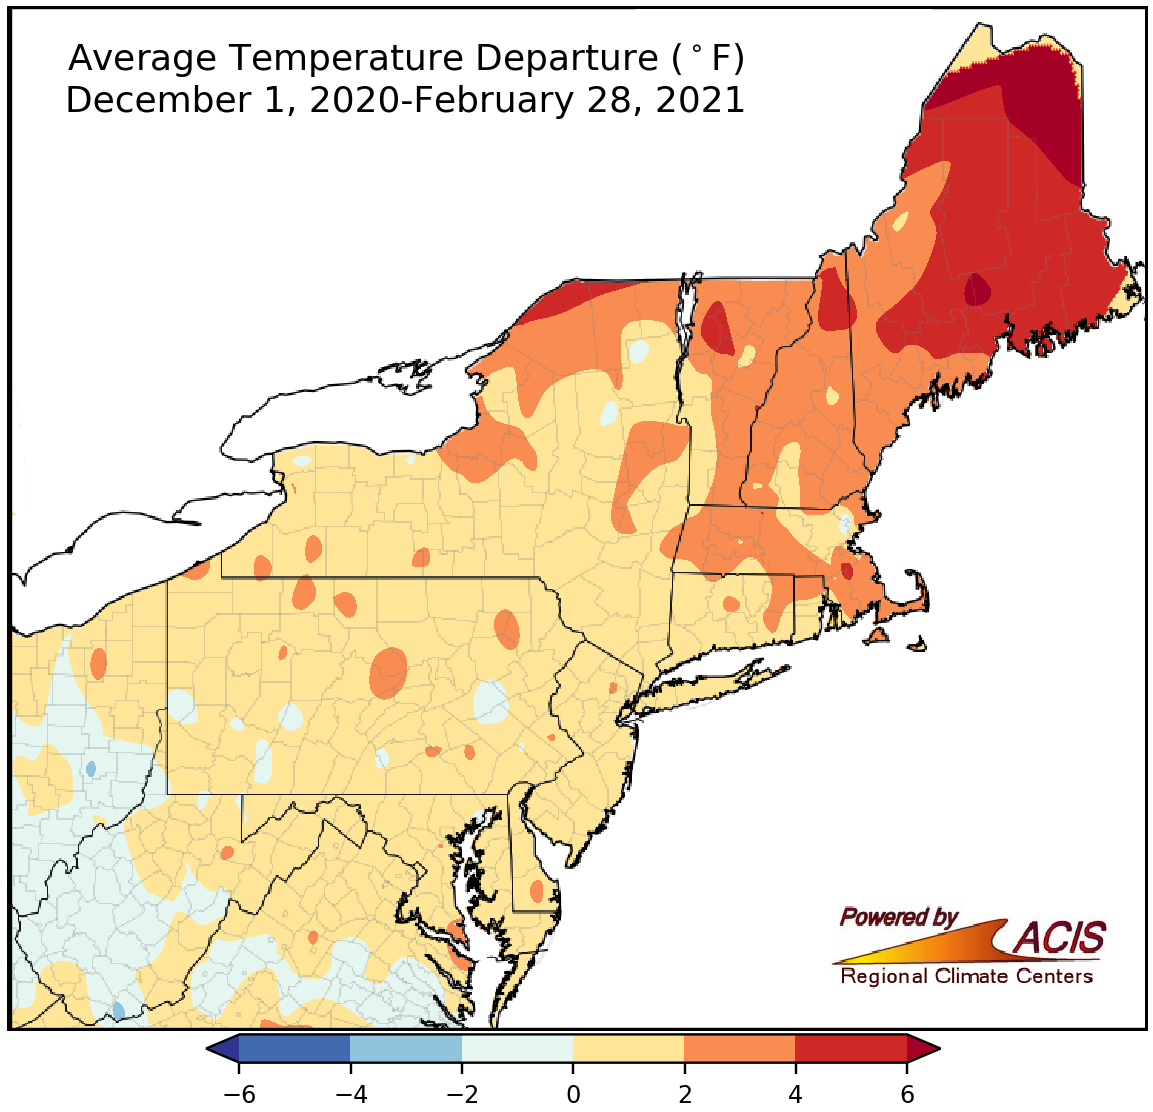
Winter average temperatures ranged from 2°F below normal to more than 6°F above normal.
While winter average temperatures ranged from 2°F below normal in parts of West Virginia and Pennsylvania to more than 6°F above normal in parts of Maine, most areas wrapped up the season on the warm side of normal. At the 35 major climate sites, winter average temperatures ranged from 1.0°F below normal in Charleston, WV, to 6.4°F above normal in Caribou, ME. Six of the 30 warmer-than-normal major climate sites ranked this winter among their 20 warmest on record.
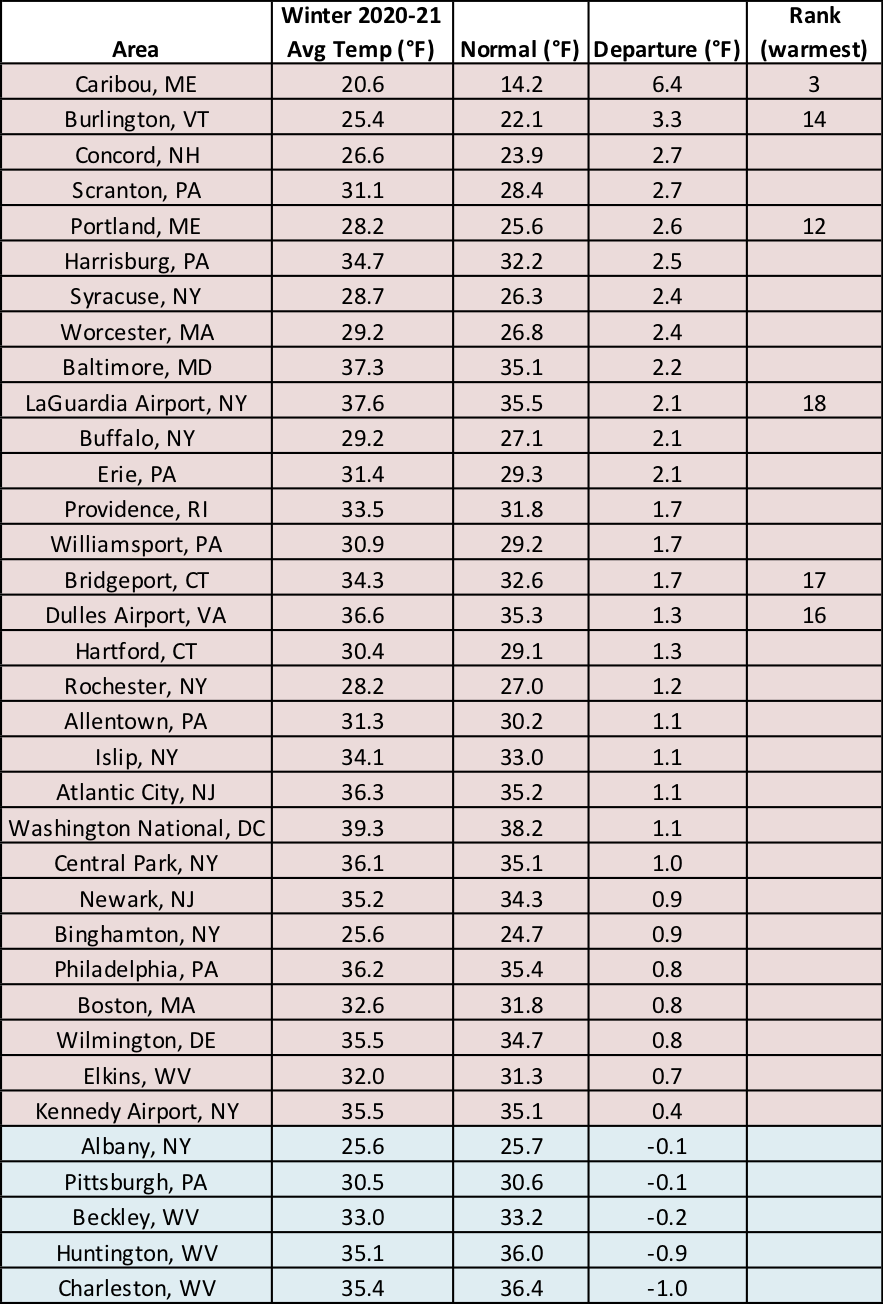
Six major climate sites ranked this winter among their 20 warmest on record.
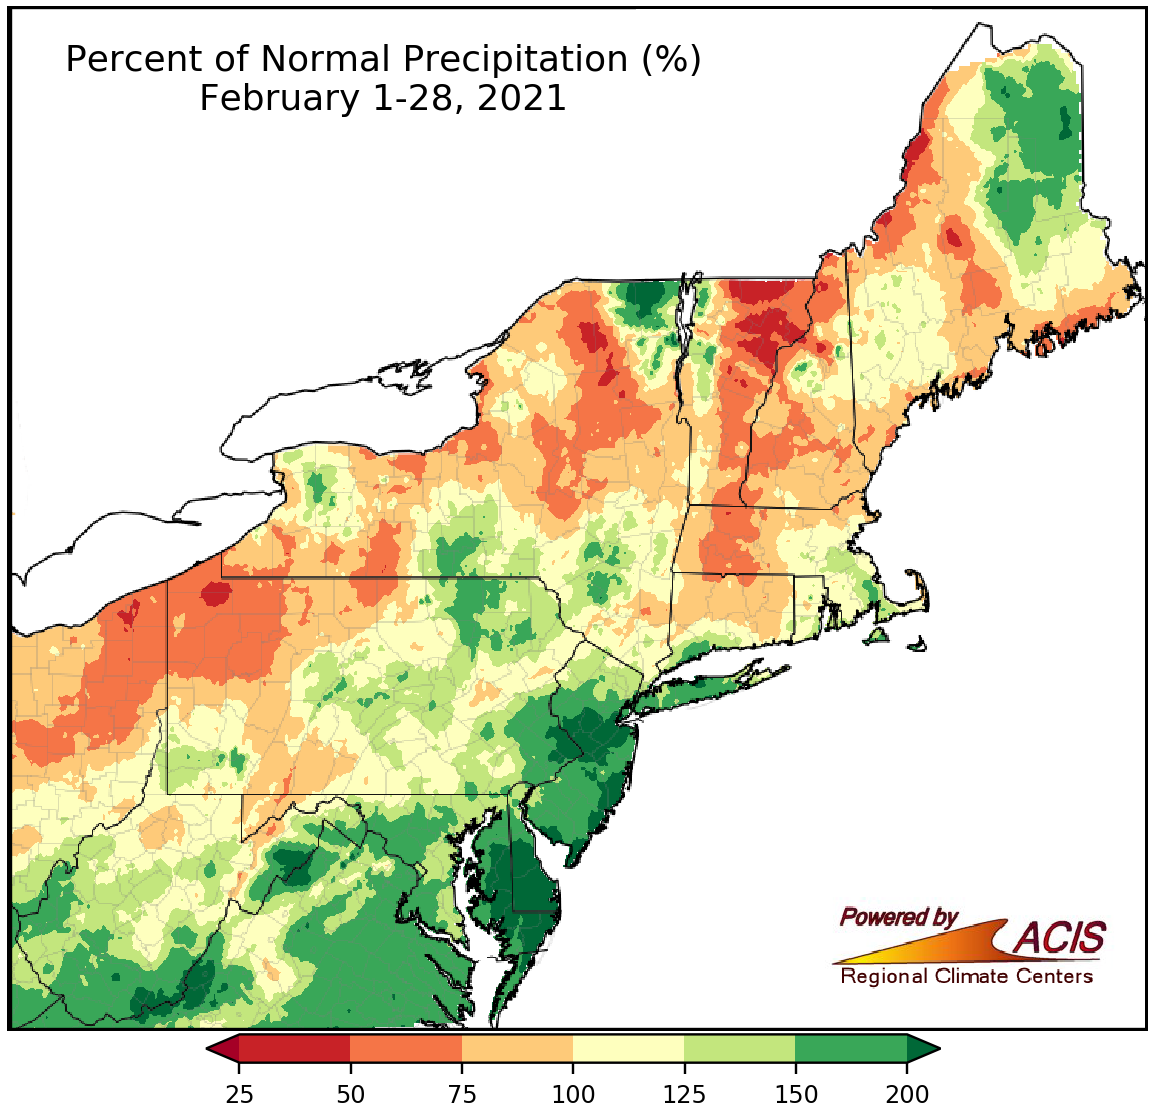
February precipitation ranged from 25% of normal to more than 200% of normal.
While February tended to be colder and snowier than normal, precipitation varied, ranging from 25% of normal to more than 200% of normal. Similarly, precipitation at the major climate sites ranged from 70% of normal in Erie, PA, to 211% of normal in Atlantic City, NJ. Twenty-six of the major climate sites saw a wetter-than-normal February, with 16 of those ranking this February among their 20 wettest on record.
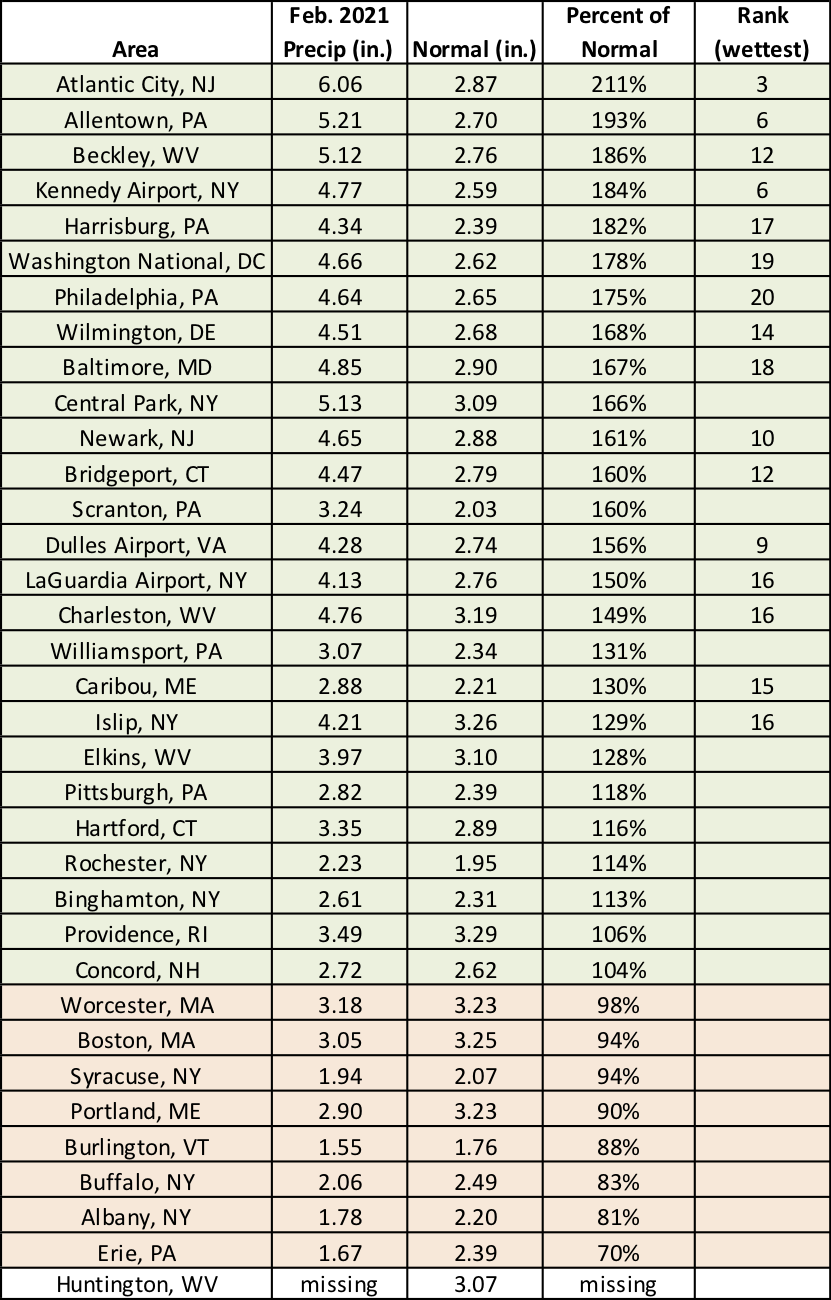
Sixteen major climate sites ranked this February among their 20 wettest on record.
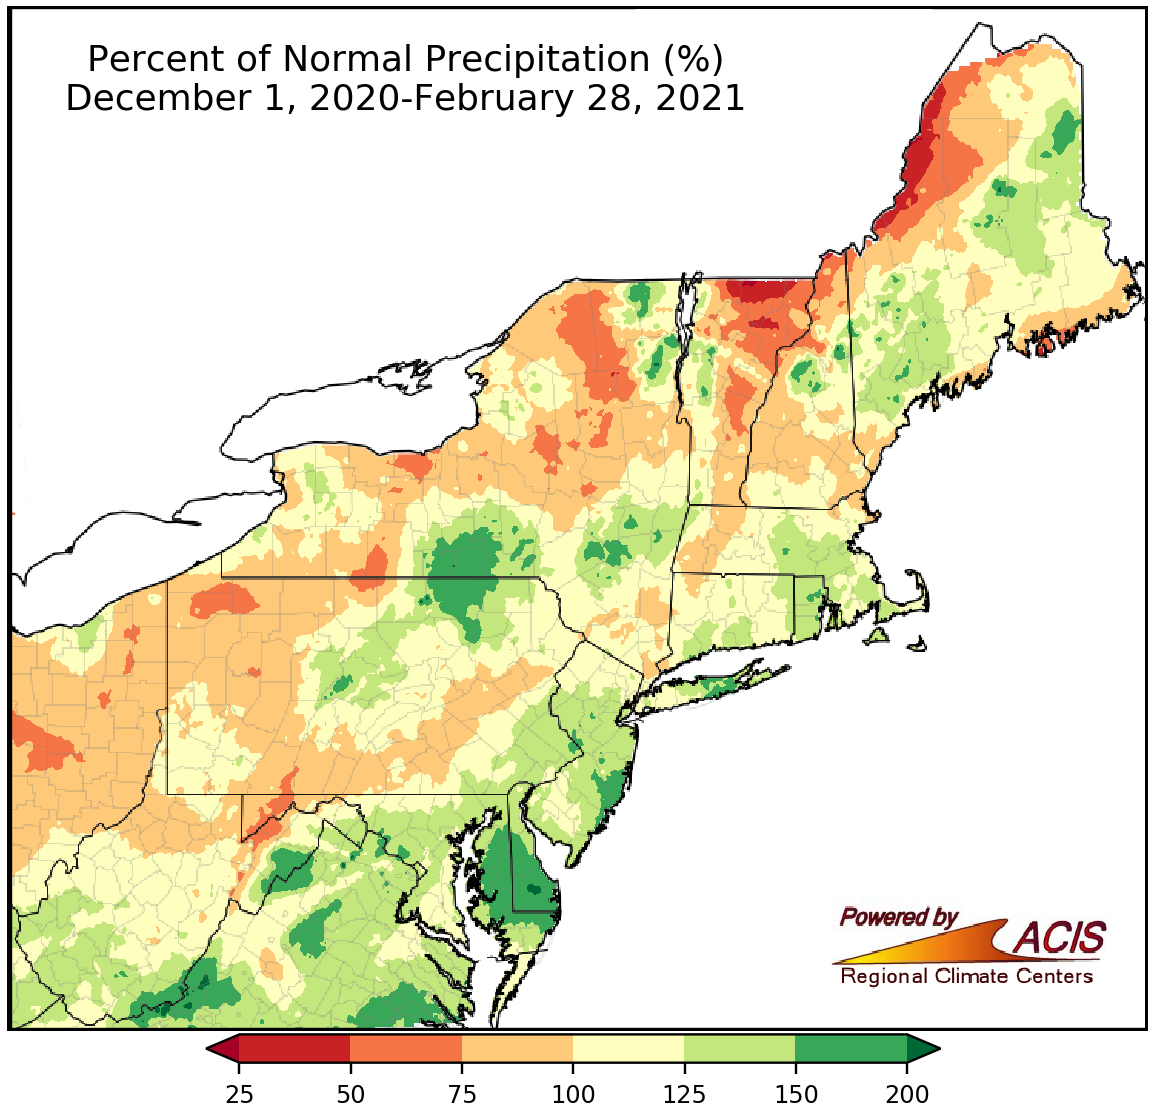
Winter precipitation ranged from 50% of normal to 200% of normal.
Winter precipitation also varied, ranging from 50% of normal to 200% of normal. At the major climate sites, winter precipitation ranged from 73% of normal in Burlington, VT, to 143% of normal at Dulles Airport, VA. Overall, 24 major climate sites were wetter than normal, with four of those sites ranking this winter among their 20 wettest on record.
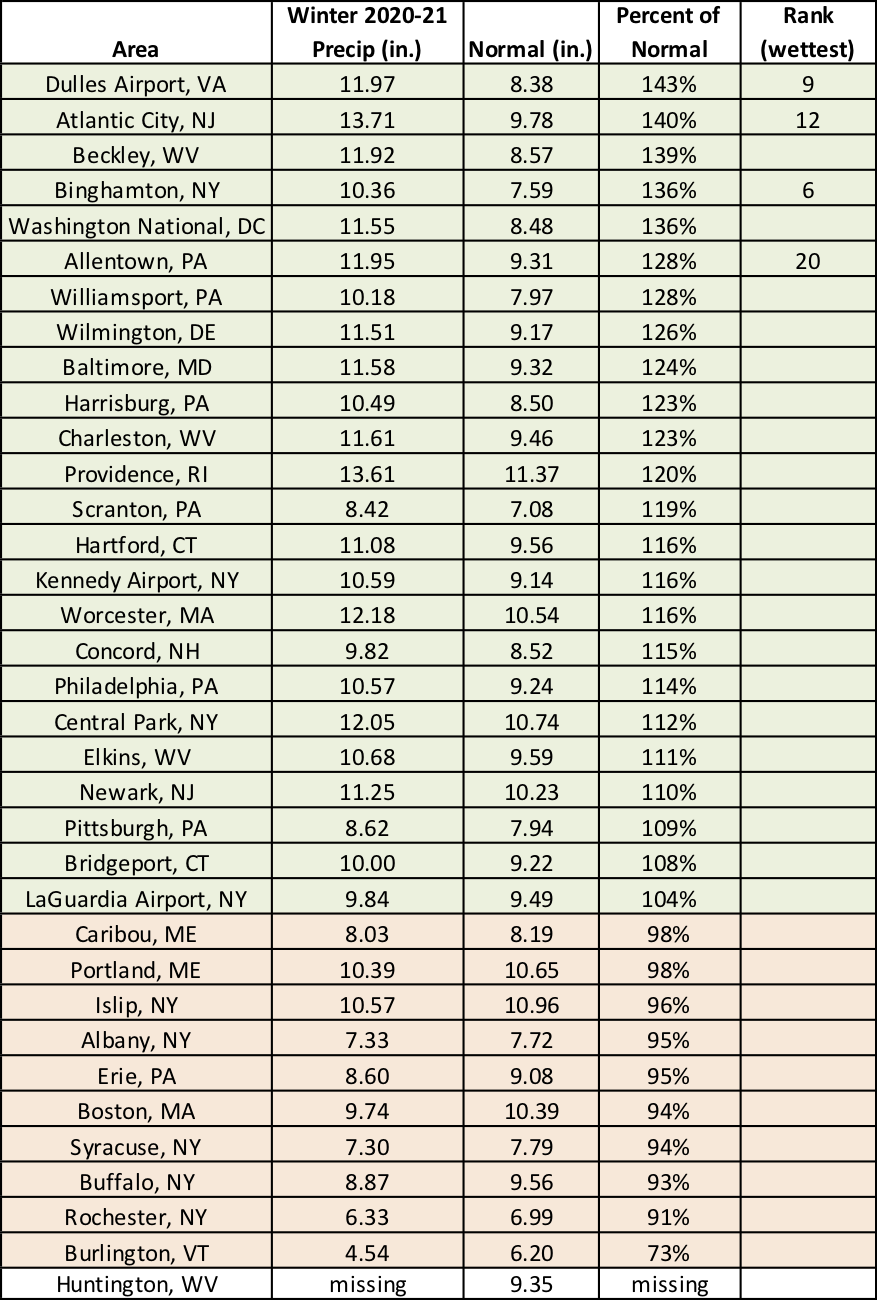
Four major climate sites ranked this winter among their 20 wettest on record.
For March, NOAA’s Climate Prediction Center indicates a tilt toward above-normal temperatures for the entire Northeast. There’s an increased likelihood of above-normal precipitation for western portions of New York, Pennsylvania, and West Virginia, with equal chances of below-, near-, or above-normal precipitation predicted for the rest of the region.
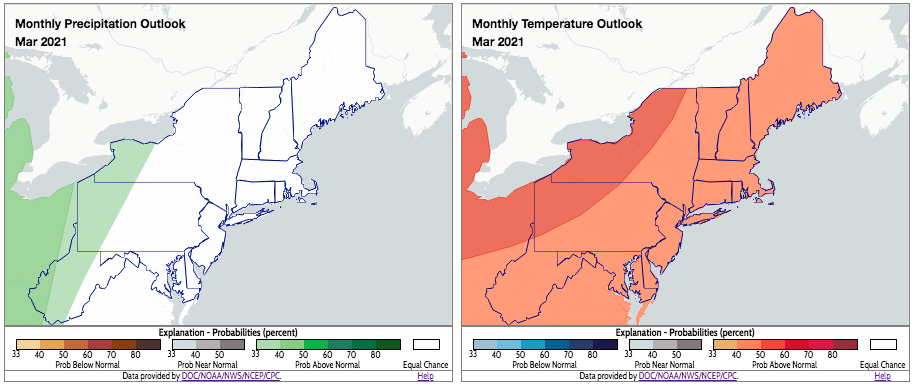
The Northeast is expected to see a warmer-than-normal March, while areas shaded green could also be wetter than normal. Click to enlarge.