November - Not Like the Rest of Fall
November average temperatures ranged from 4°F below normal to 2°F above normal.
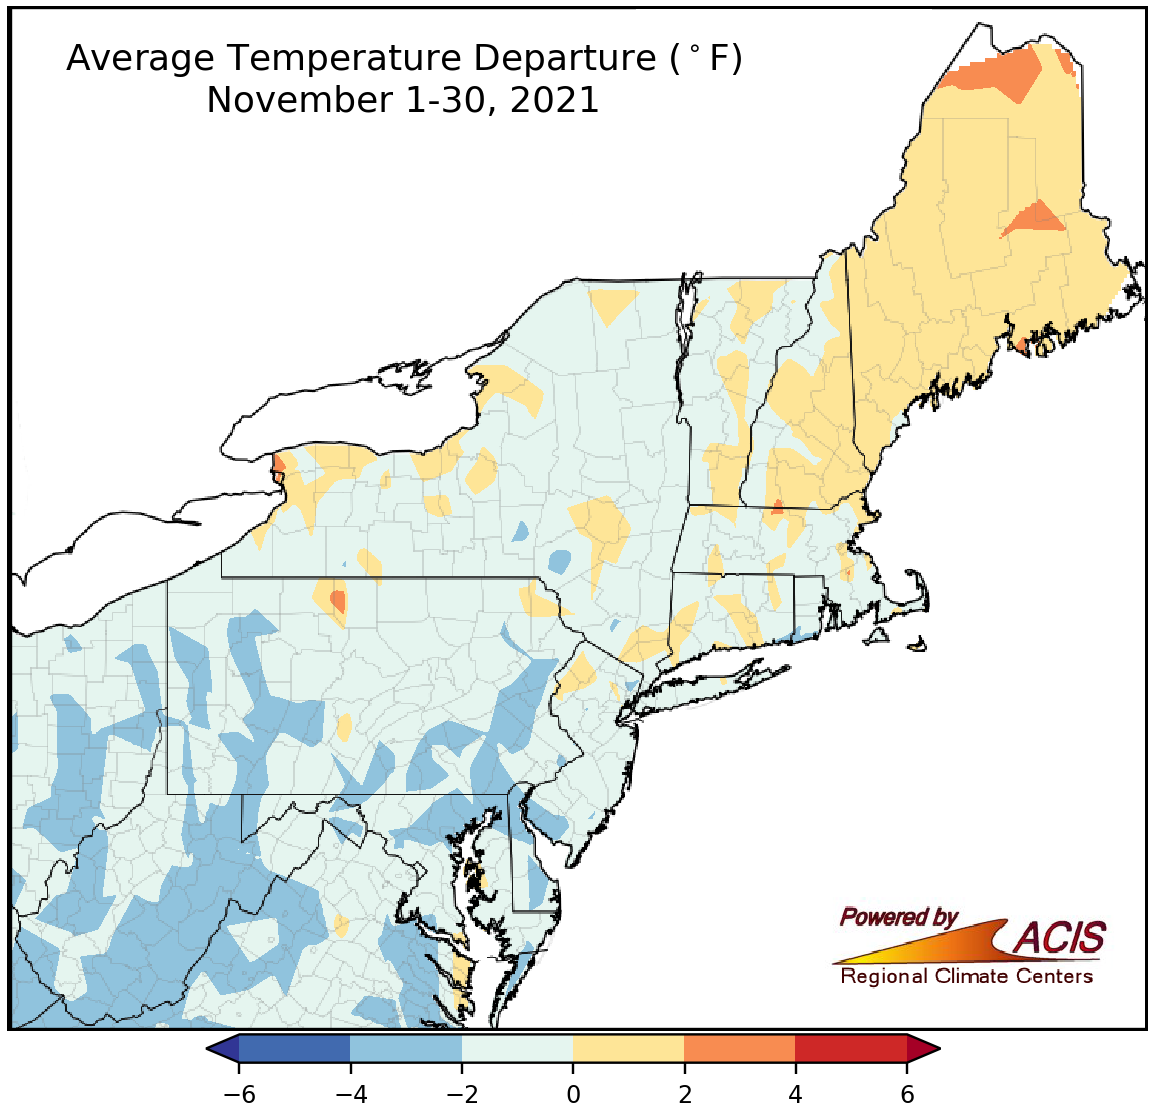
Much of the Northeast experienced a cooler-than-normal November, with average temperatures ranging from as much as 4°F below normal to near normal. However, a few spots, mostly in New York and New England, were as much as 2°F warmer than normal. November average temperatures at the 35 major climate sites ranged from 3.7°F below normal in Allentown, PA, to 1.5°F above normal in Caribou, ME, its 20th warmest November. Overall, 29 of the sites were colder than normal, with Allentown, PA, and Dulles Airport, VA, having one of their 20 coolest Novembers on record.
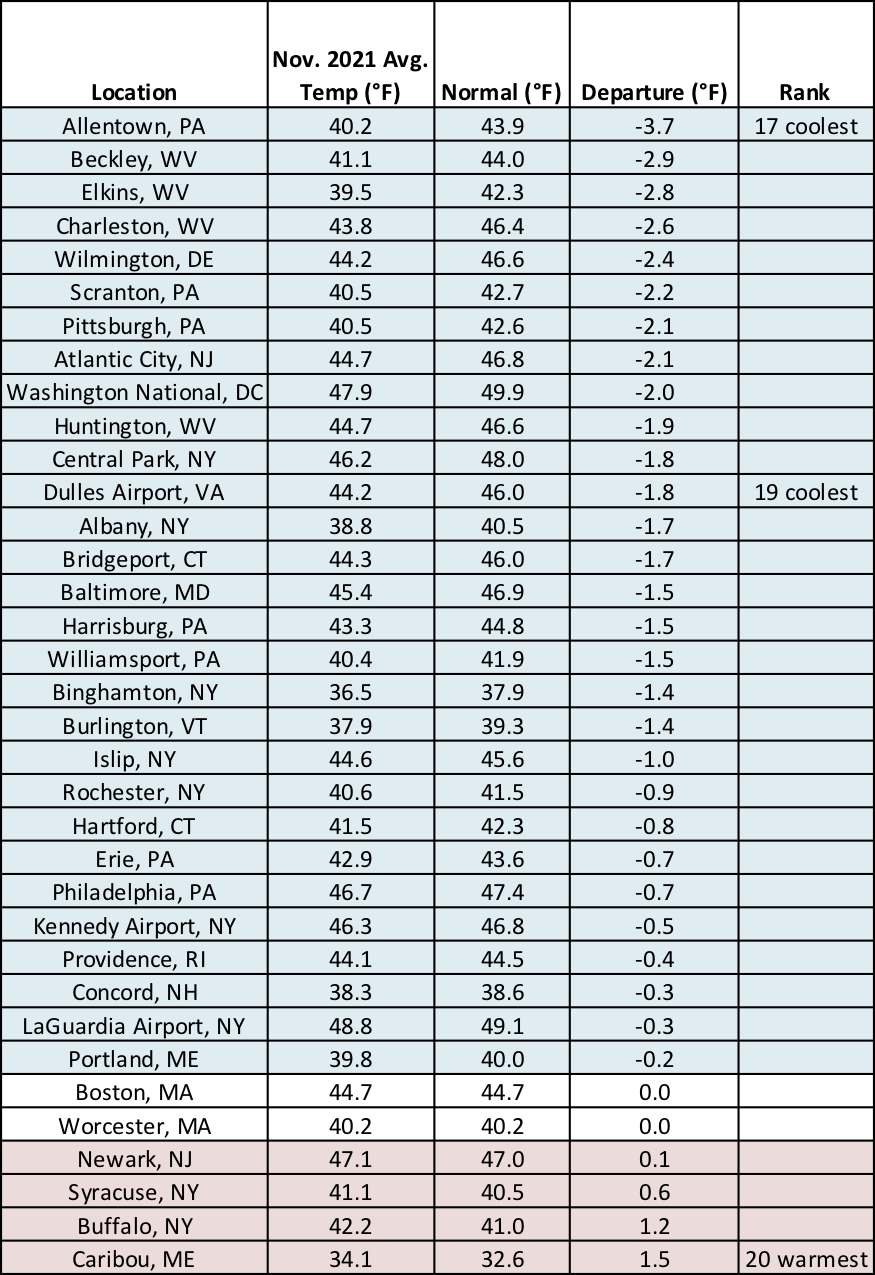
A majority of the major climate sites experienced a cooler-than-normal November, with two having one of their 20 coolest November on record.
Fall average temperatures ranged from near normal to 4°F above normal.
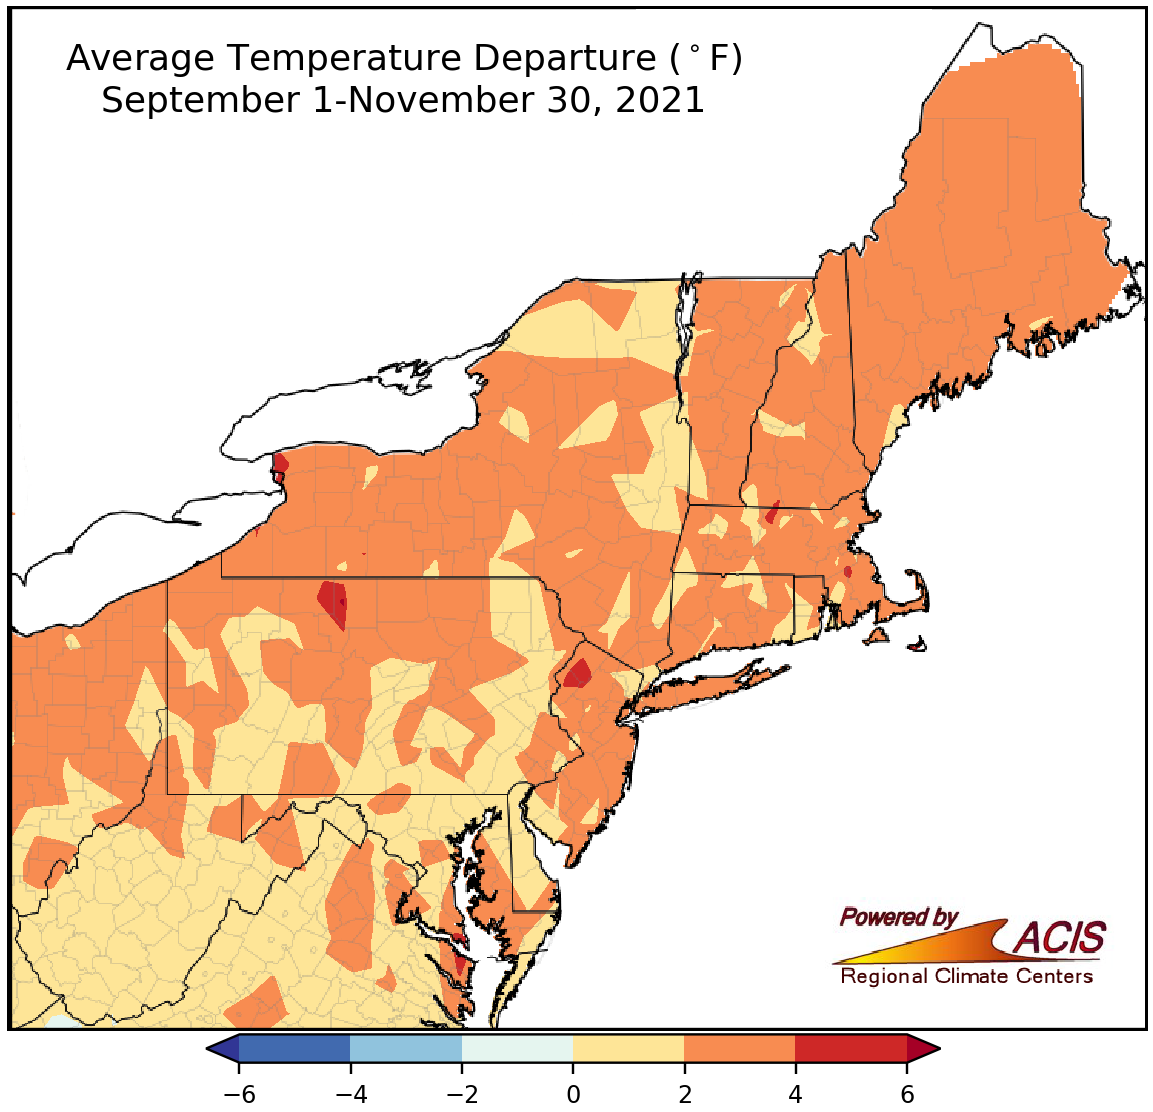
The warmth of September and October overcame the coolness of November, allowing fall average temperatures to range from near normal to as much as 4°F above normal across the Northeast. Fall average temperatures at the 35 major climate sites ranged from 0.3°F above normal in Beckley, WV, to 4.0°F above normal in Buffalo, NY. This fall was the warmest on record at Newark, NJ, and among the 20 warmest for another 28 major climate sites.
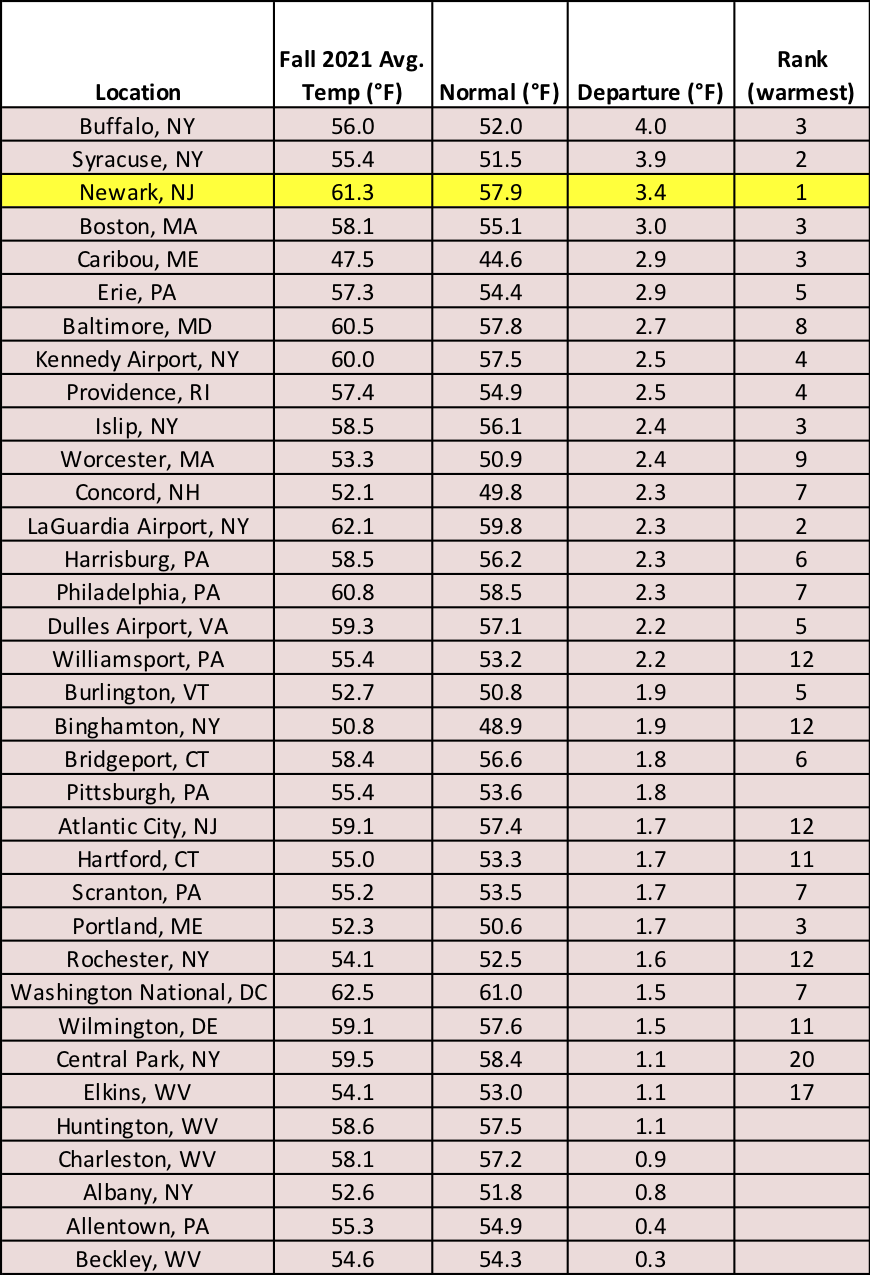
Newark, NJ, had its warmest fall on record, while another 28 major climate sites had one of their 20 warmest falls.
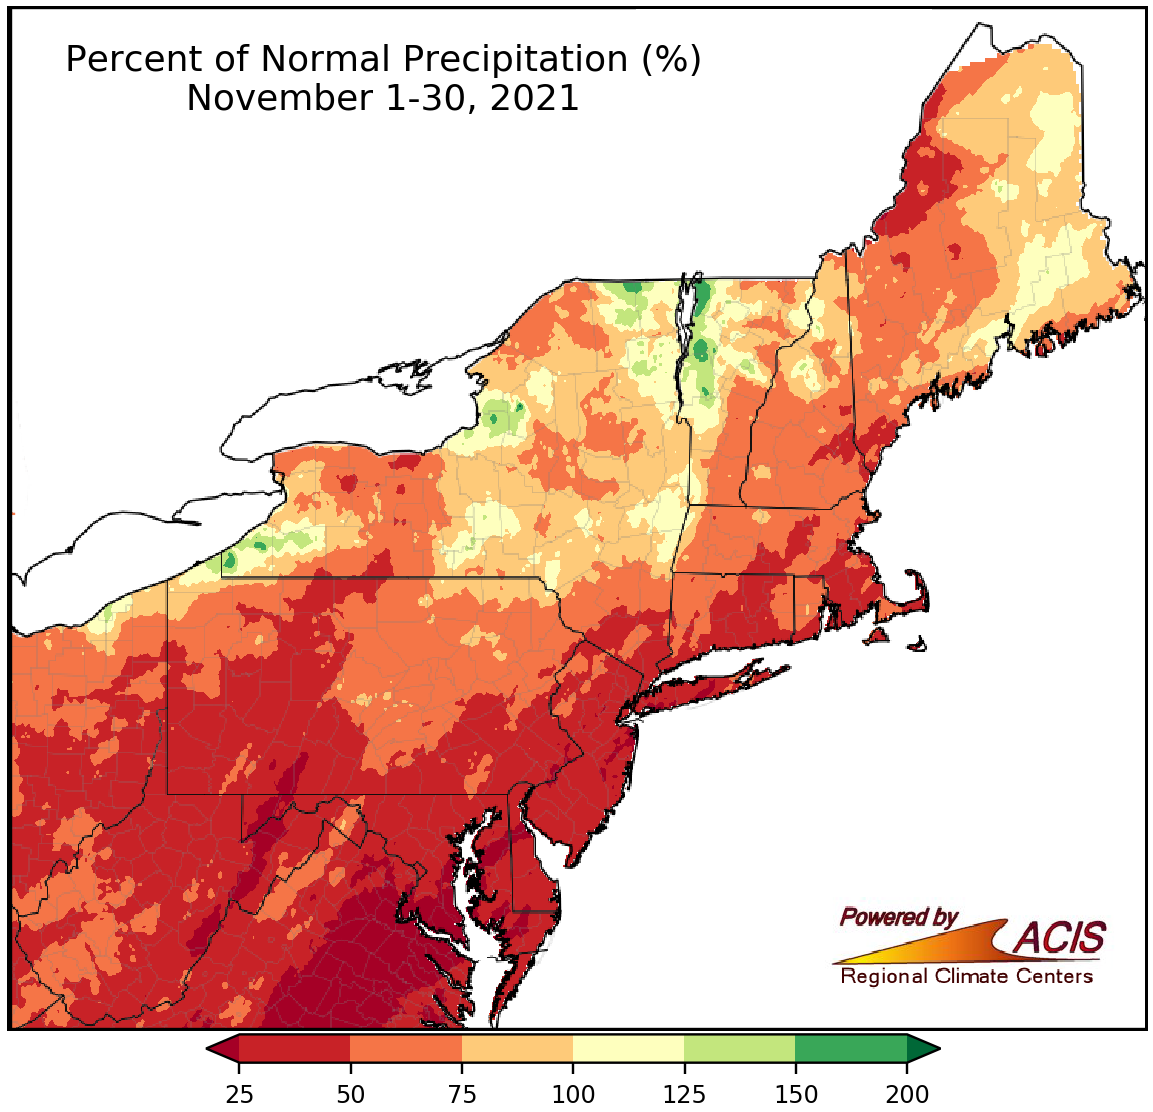
November precipitation ranged from less than 25% of normal to 125% of normal for most areas.
Much of the Northeast was drier than normal in November, with the driest locations, including parts of West Virginia, Maryland, and Pennsylvania, seeing less than 25% of normal precipitation. However, several locations, particularly in New York and northern New England, saw between 100% and 200% of normal precipitation. At the 35 major climate sites, November precipitation ranged from 16% of normal in Philadelphia, PA, to 117% of normal in Burlington, VT. Eighteen of the 32 drier-than-normal major climate sites ranked this November among their 20 driest on record. Drought and abnormally dry conditions lingered in northern New England, while abnormal dryness expanded in parts of West Virginia and Maryland during November.
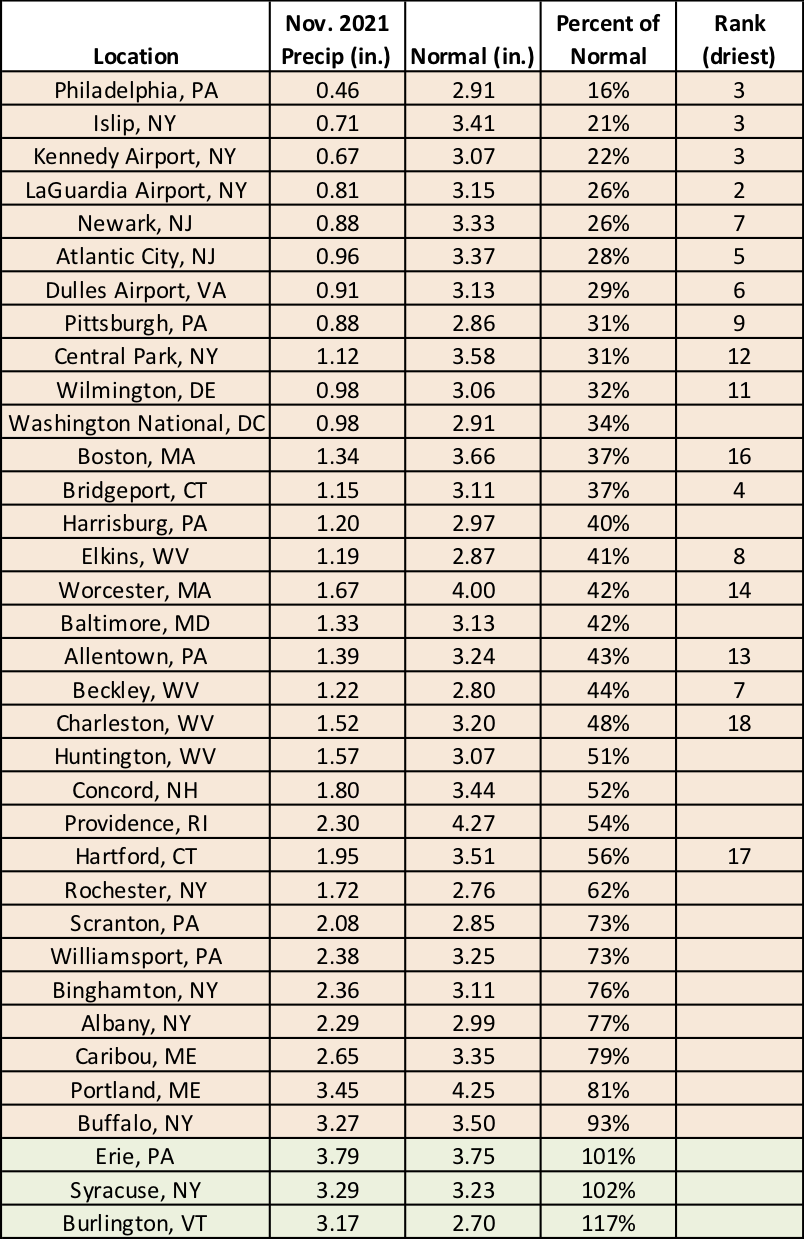
This November ranked among the 20 driest on record for 18 major climate sites.
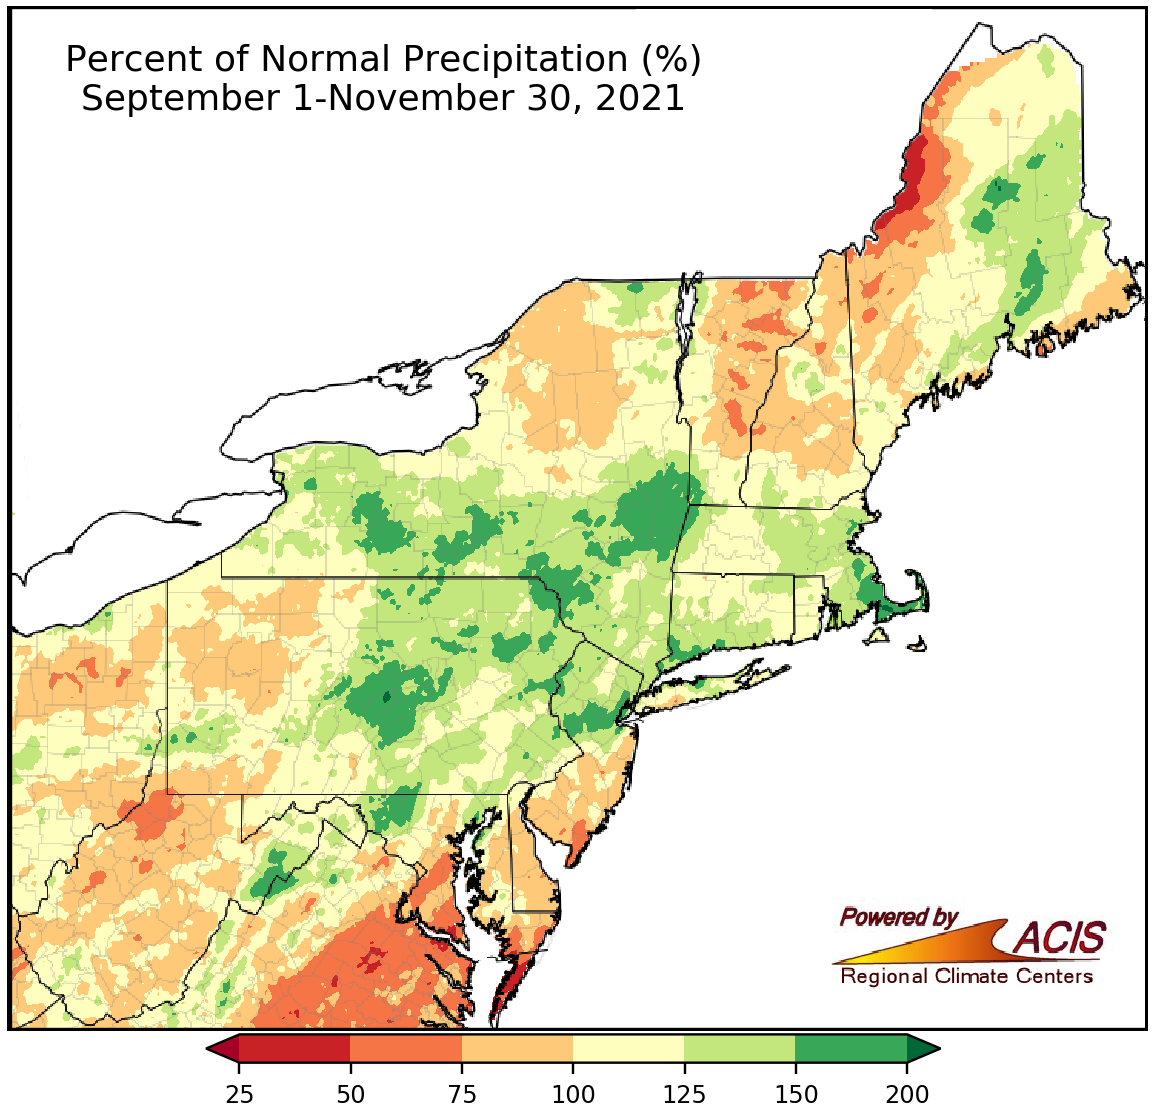
Fall precipitation ranged from 50% of normal to 200% of normal.
September and October precipitation varied with many spots being wetter than normal, but November was drier than normal for most areas. With that, fall precipitation also varied, ranging from 50% of normal to 200% of normal. Fall precipitation at the 35 major climate sites ranged from 74% of normal in Huntington and Beckley, WV, to 160% of normal in Scranton, PA. Of the 24 wetter-than-normal major climate sites, 13 ranked this fall among their 20 wettest on record.
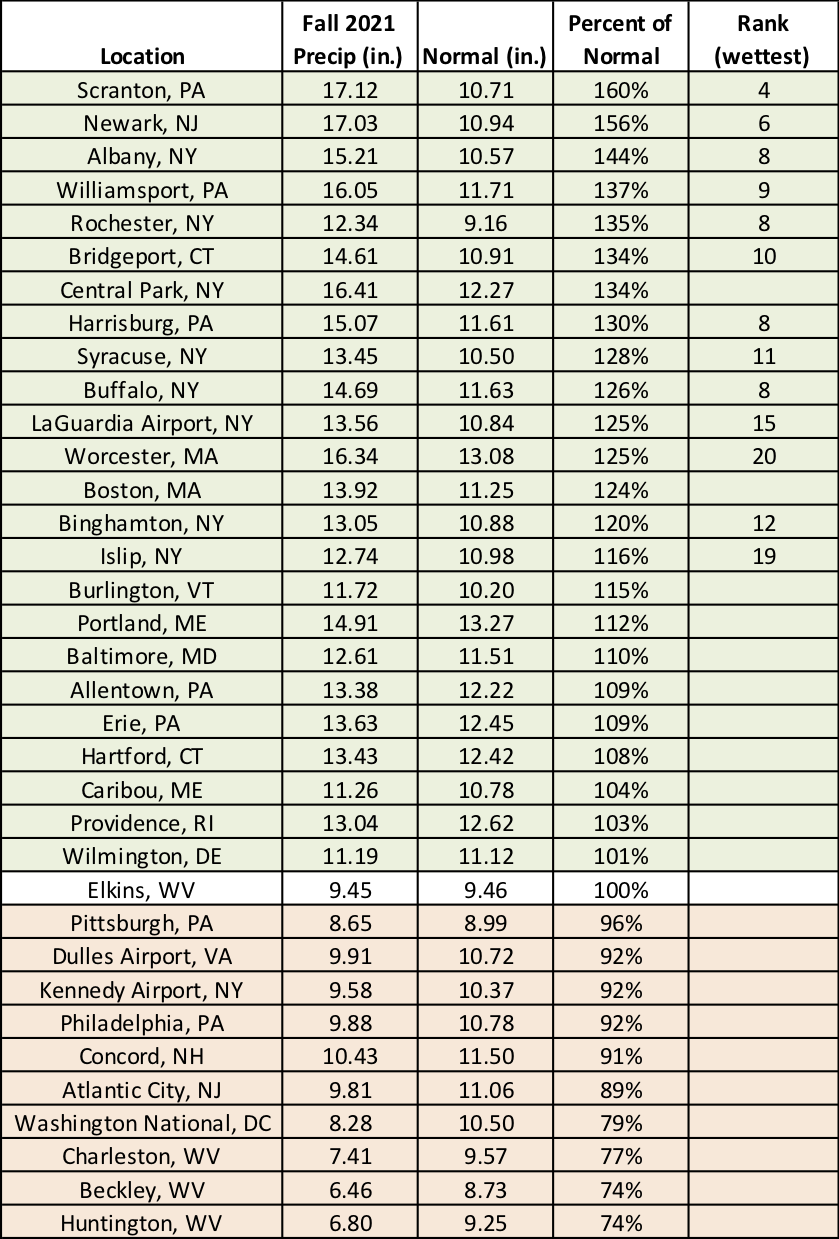
This fall ranked among the 20 wettest on record for 13 major climate sites.
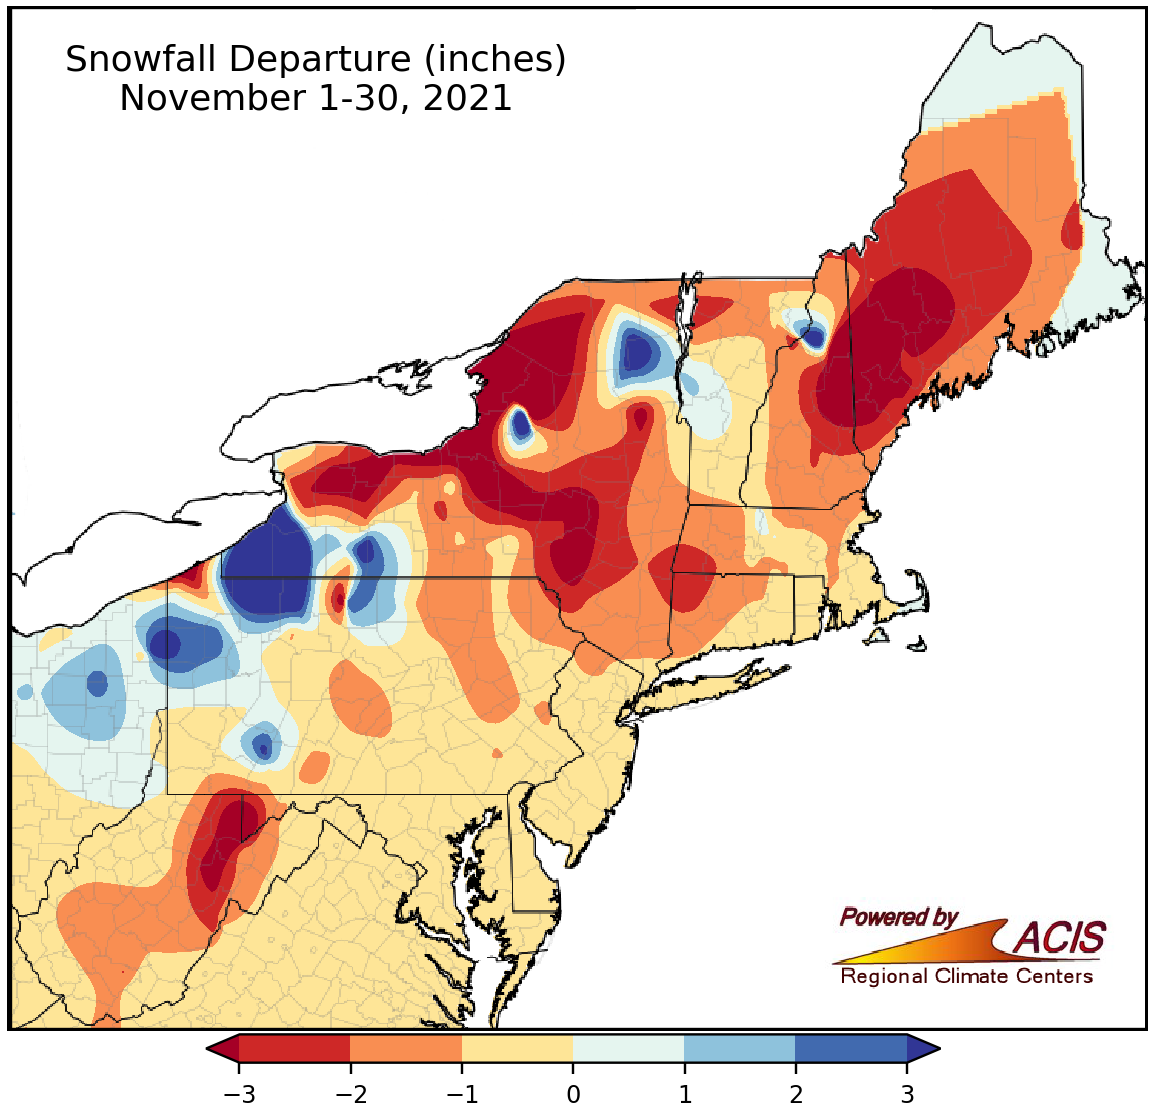
November snowfall ranged from more than 3 inches below normal to more than 3 inches above normal.
Many parts of the Northeast saw below- or near-normal snowfall during November. The largest deficits of more than 3 inches were in higher elevations of West Virginia, near Lake Ontario in New York, and along the New Hampshire-Maine border. Meanwhile, the greatest surpluses of more than 3 inches were generally found in northwestern Pennsylvania, as well as southwestern and northeastern New York. All of the 35 major climate sites saw below- or near-normal November snowfall with Syracuse, NY, having the largest deficit of 5.6 inches.
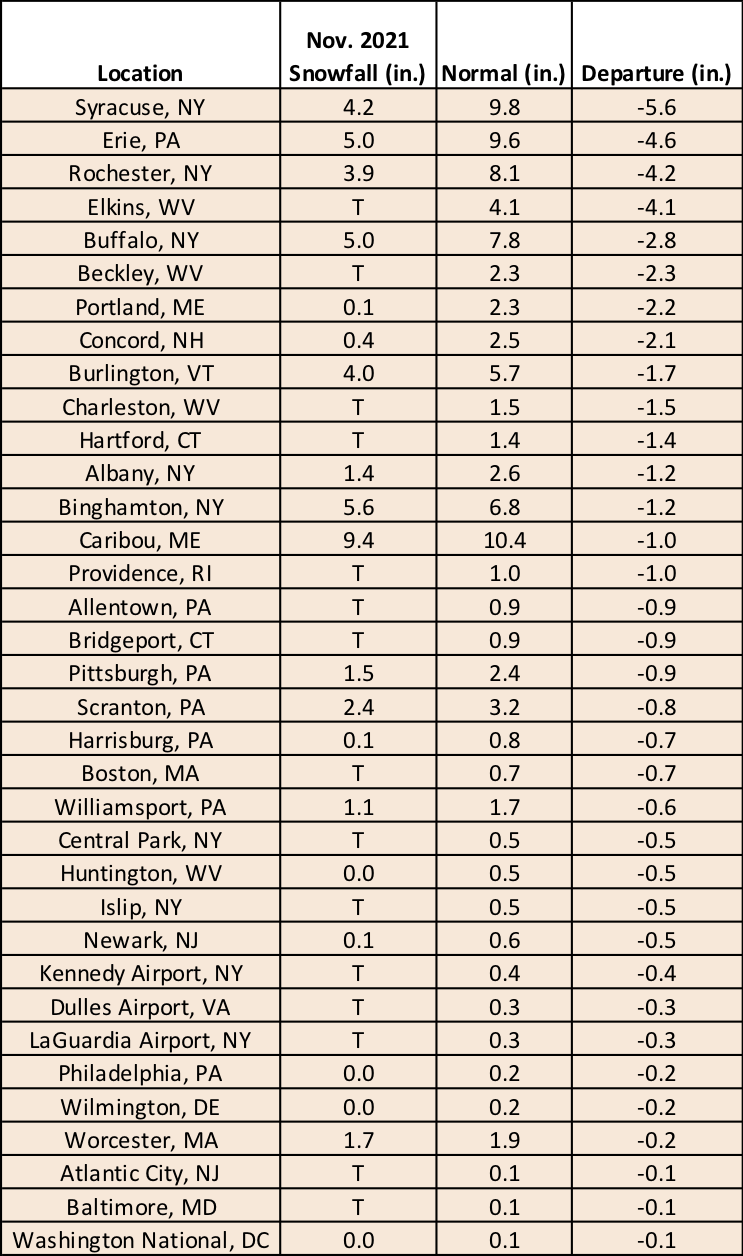
November snowfall was below- or near-normal, with Syracuse, NY, having the largest deficit of 5.6 inches.
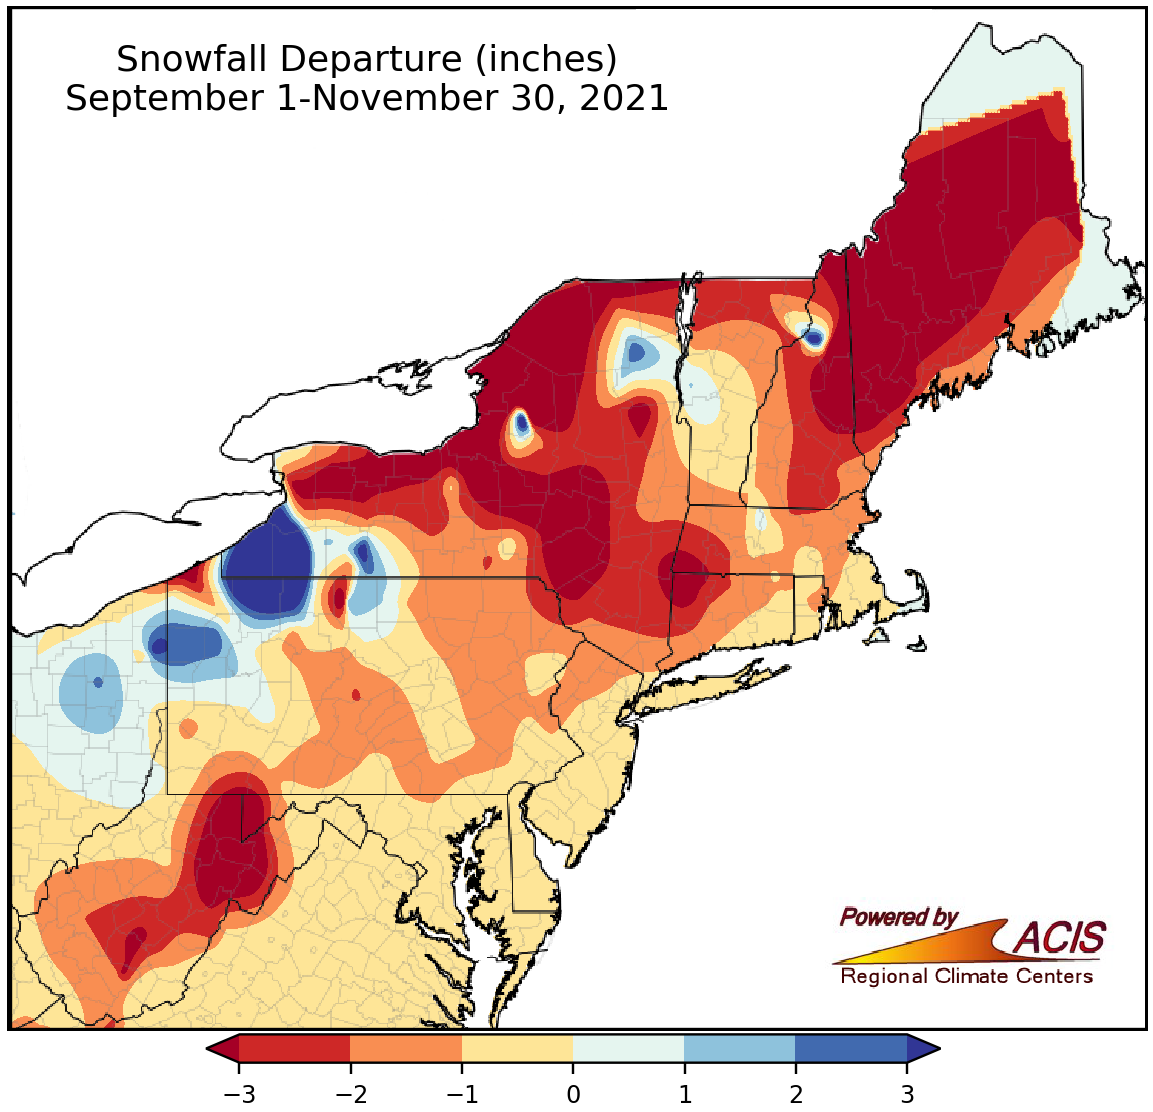
Fall snowfall ranged from more than 3 inches below normal to more than 3 inches above normal.
Similar to November, most of the Northeast saw below- or near-normal snowfall, with the largest deficits exceeding 3 inches. However, a few spots in southwestern New York and northwestern Pennsylvania had a surplus of over 3 inches. All of the 35 major climate sites saw below- or near-normal fall snowfall with Syracuse, NY, having the largest deficit of 5.8 inches.
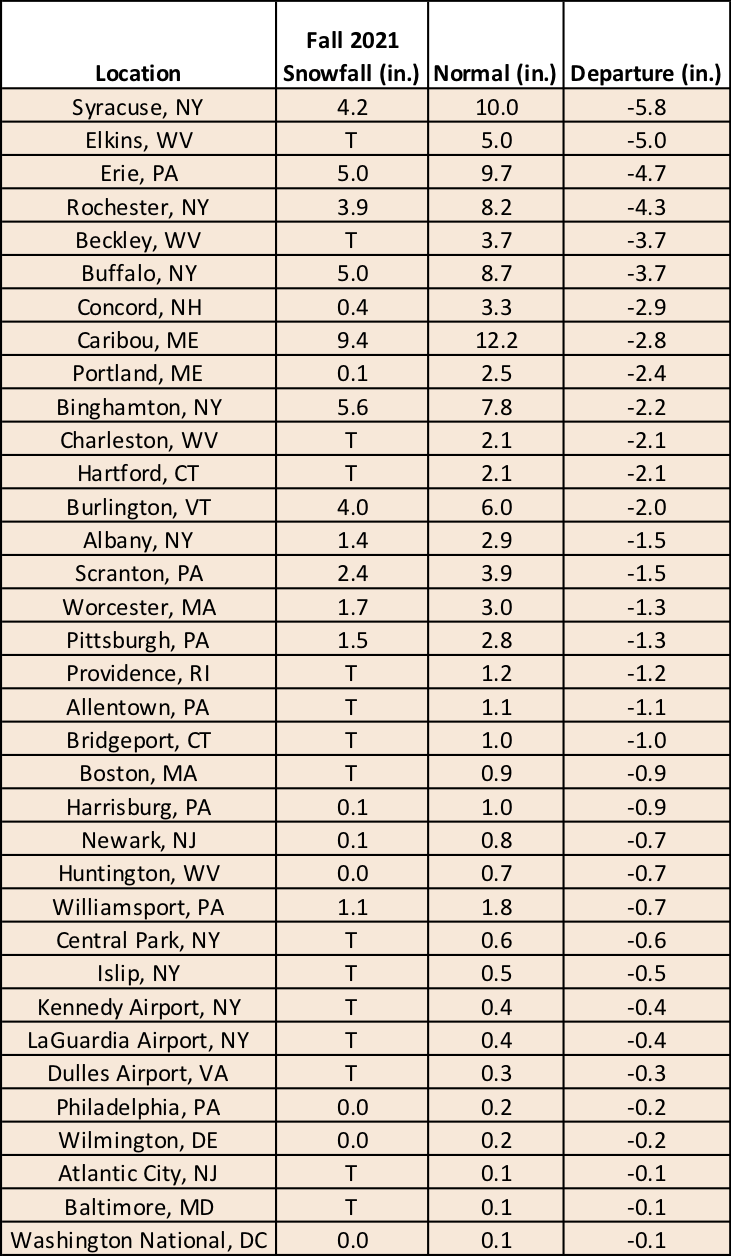
November snowfall was below- or near-normal, with Syracuse, NY, having the largest deficit of 5.8 inches.
According to NOAA’s Climate Prediction Center, there’s an increased likelihood that December will be warmer than normal for portions of the Northeast, including West Virginia, Maryland, Delaware, much of Pennsylvania, southern New Jersey, and southwestern New York. Equal chances of below-, near-, or above-normal temperatures were forecast for the rest of the Northeast.
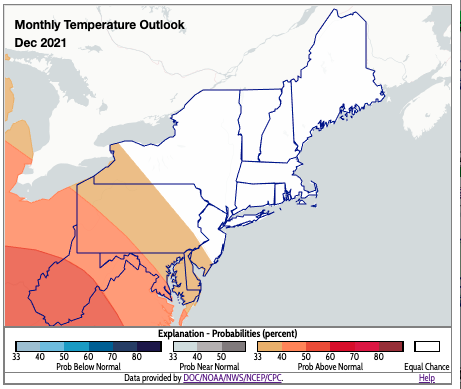
December is expected to be warmer than normal in areas shaded orange.
There’s a tilt toward drier-than-normal conditions in the southeastern corner of the region. Meanwhile, there’s an increased probability of seeing wetter-than-normal conditions in northwestern Pennsylvania and lake-effect areas of New York. The rest of the region falls into the equal chances category.
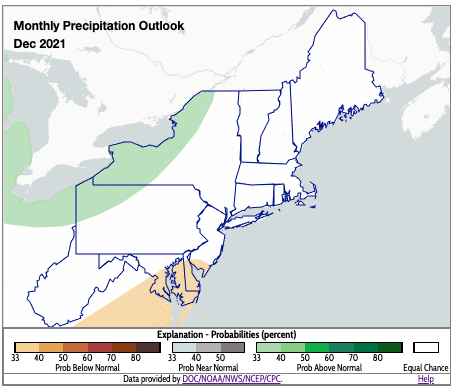
Areas shaded tan are expected to be drier than normal for December, while areas shaded green are expected to be wetter than normal.