Warm Winter
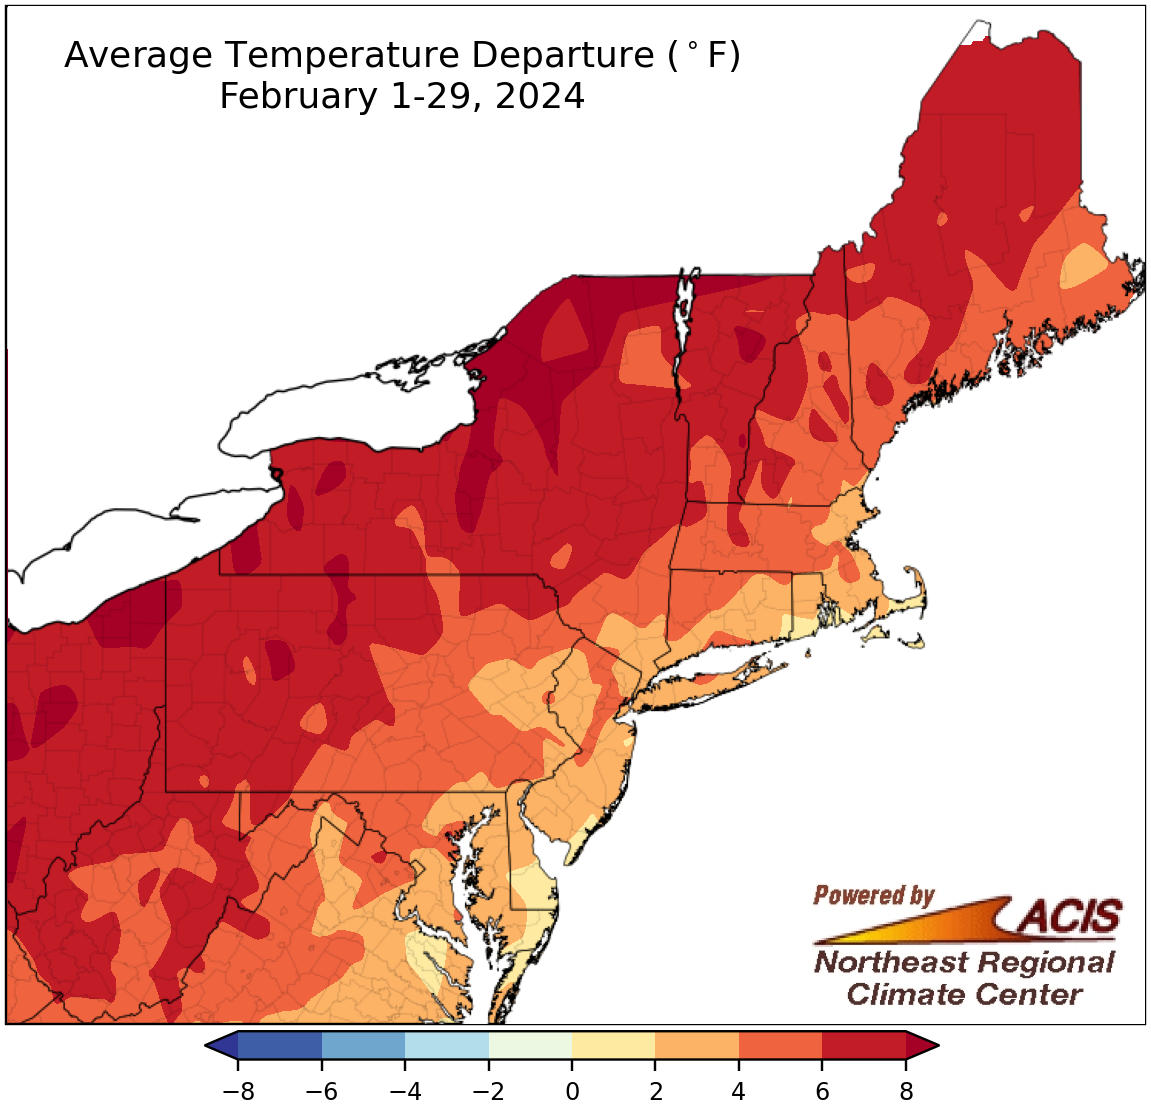
February average temperatures ranged from near normal to more than 8°F above normal.
The entire Northeast experienced a warmer-than-normal February with average temperatures ranging from near normal in some coastal areas to more than 8°F above normal in interior locations like western New York and western Pennsylvania. February 2024 went into the record books as the warmest February for Syracuse, Buffalo, and Albany, NY, and ranked among the 20 warmest Februarys on record for the remaining 32 major climate sites. Average temperatures for the month at all the major climate sites ranged from 2.0°F above normal in Atlantic City, NJ, to 9.0°F above normal in Syracuse, NY.
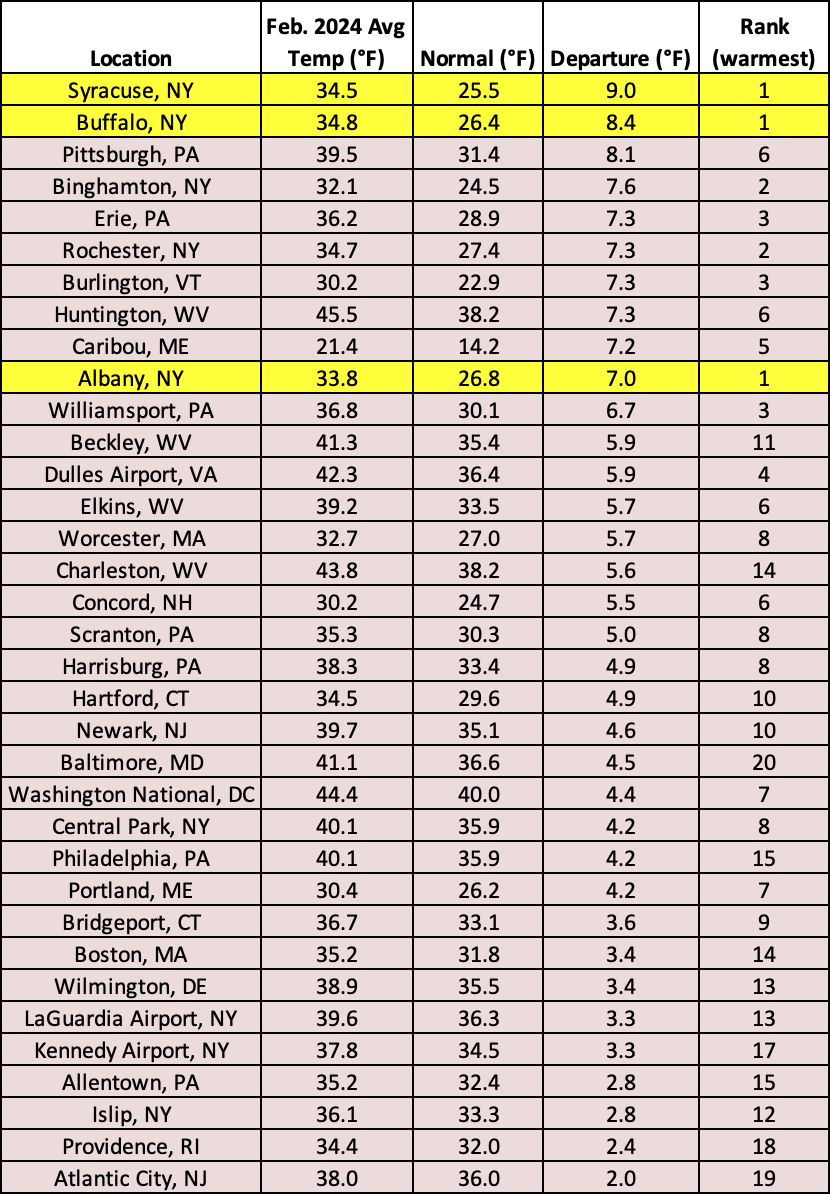
This February was record warm for three major climate sites and among the 20 warmest for the other 32 sites.
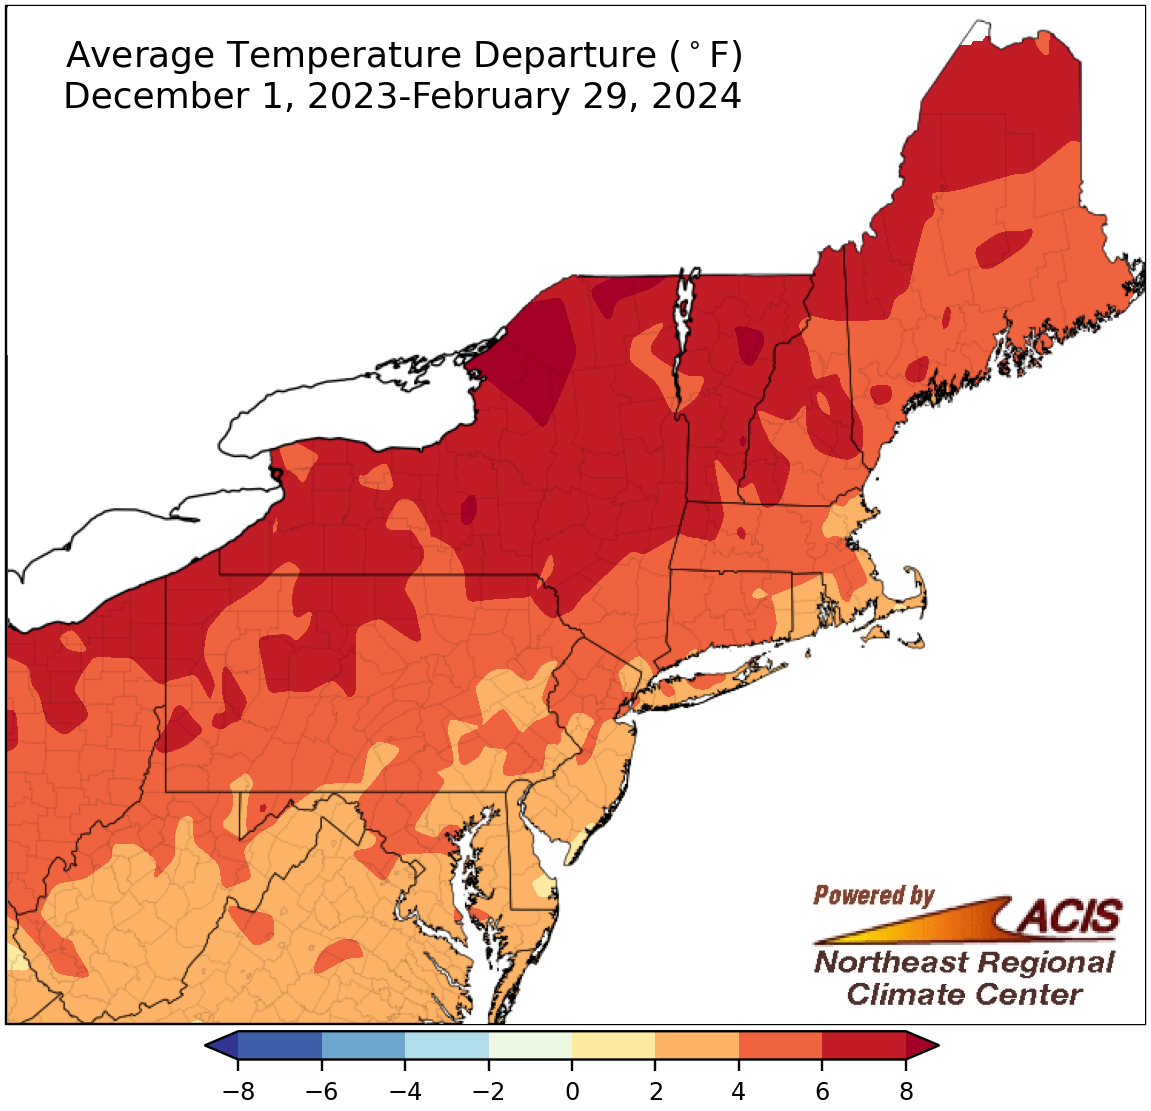
Winter average temperatures ranged from near normal to more than 8°F above normal.
The warm winter of 2023-24 was boosted by atmospheric teleconnections like a positive North Atlantic Oscillation. Cold air was hard to find as each of the three months of the season were warmer than normal for almost the entire region. Average temperatures for the winter season ranged from near normal in a few coastal spots to more than 8°F above normal in northern New York. Winter 2023-24 was record warm for six major climate sites and ranked among the 10 warmest for 28 additional major climate sites. Overall, winter temperatures at those sites ranged from 2.7°F above normal in Atlantic City, NJ, to 7.5°F above normal in Syracuse, NY. This warm winter is on the heels of the exceptionally warm winter of 2022-23.
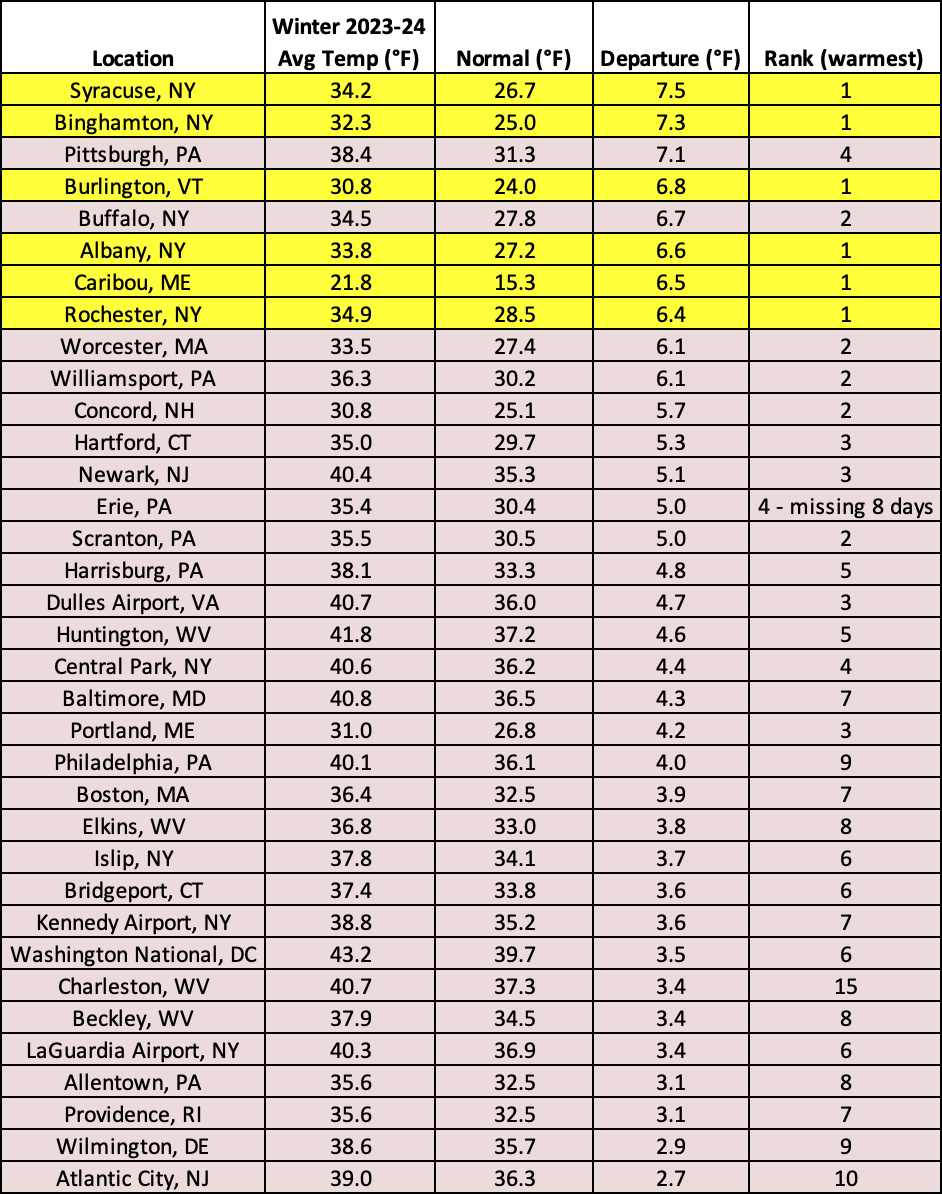
This winter was record warm for six major climate sites and among the 10 warmest for another 28 of the sites.
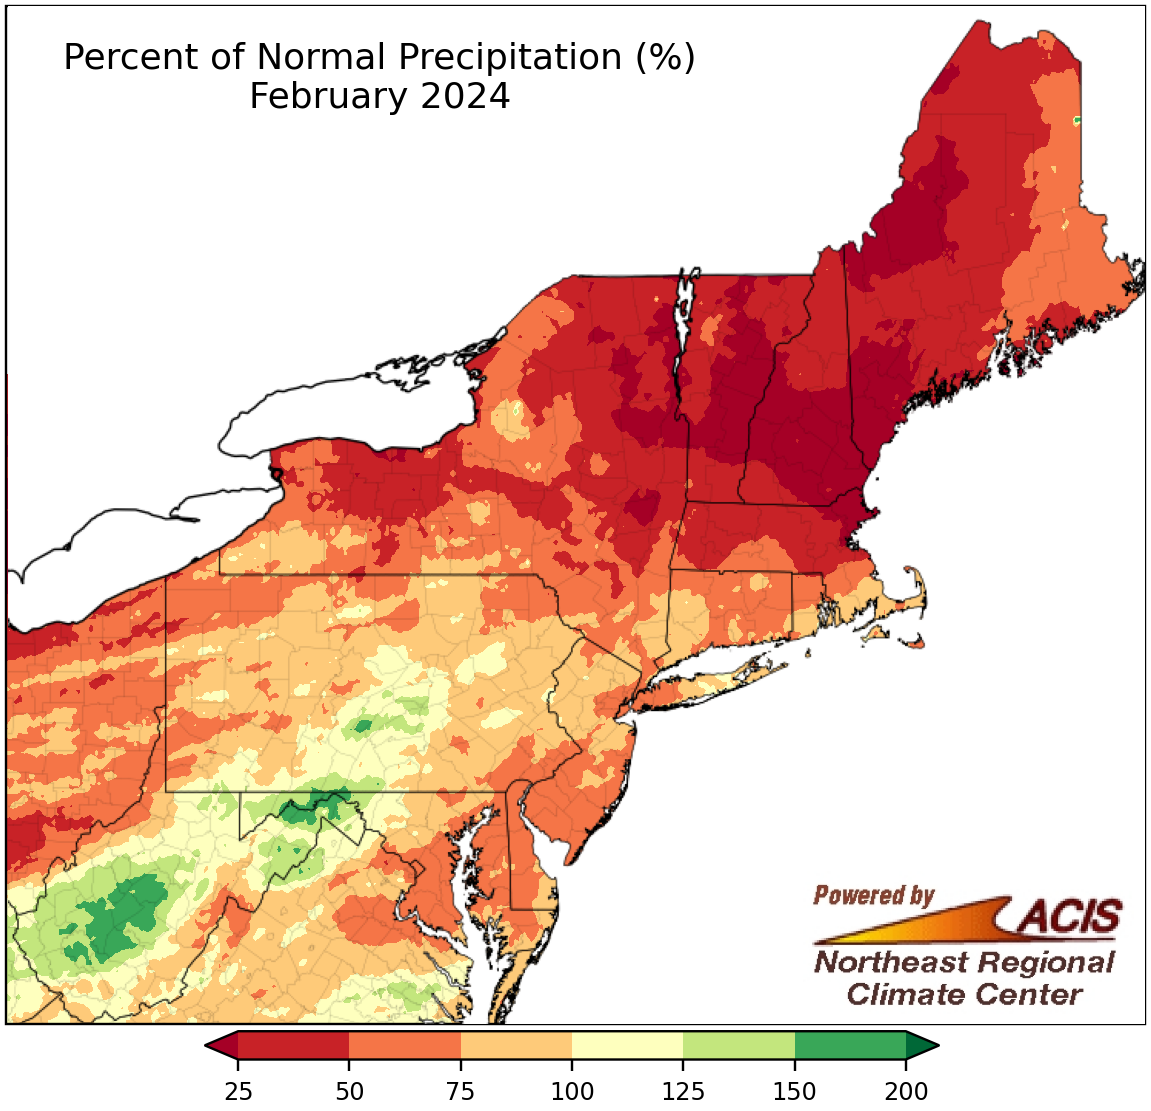
February precipitation ranged from less than 25% of normal to 200% of normal.
February wrapped up on the dry side of normal for much of the Northeast, with the driest locations in New England and eastern New York seeing less than 25% of normal precipitation. A swath of the region from West Virginia through western Maryland and into central Pennsylvania was wetter though, seeing up to 200% of normal precipitation. At the Northeast’s 35 major climate sites, February precipitation ranged from 19% of normal in Portland, ME, to 138% of normal in Charleston, WV, with 31 of the sites (all those outside of West Virginia) being drier than normal. This February ranked among the 20 driest on record at 19 major climate site’s but was the 18th wettest for Charleston.
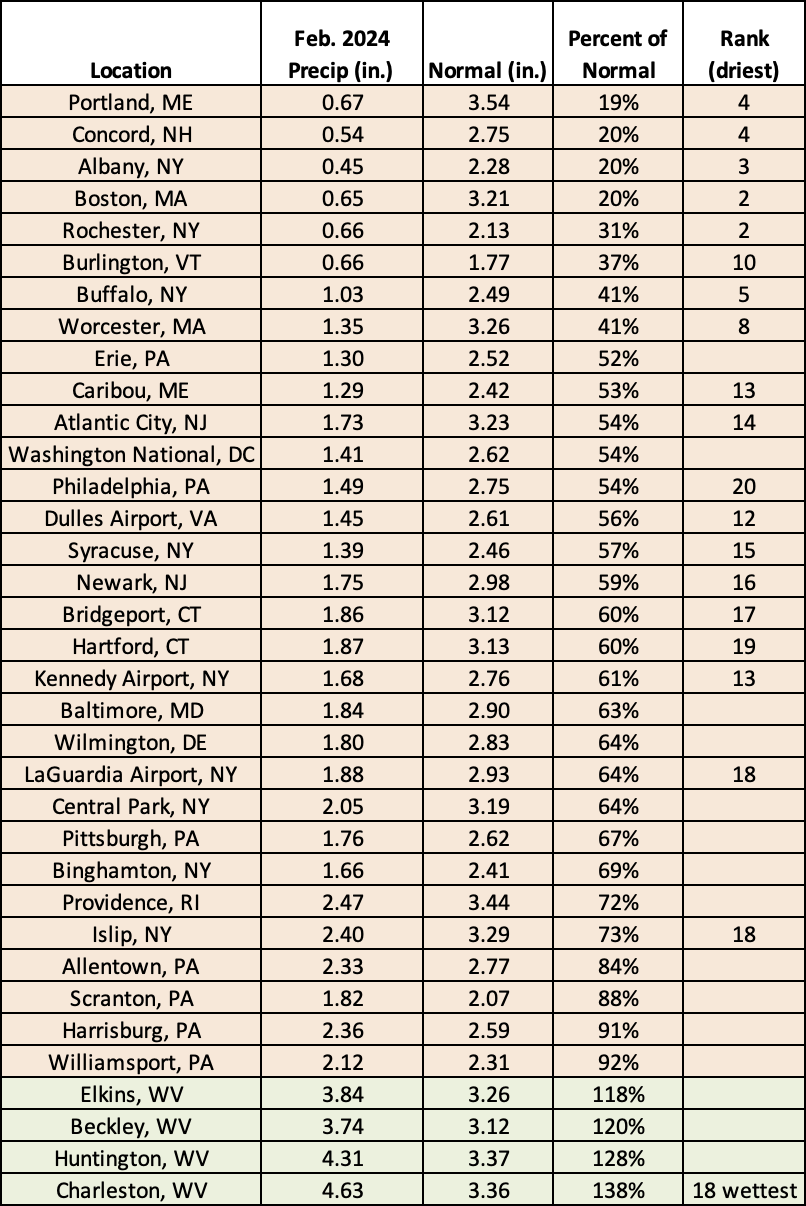
This February ranked among the 20 driest on record at 19 major climate site’s but was the 18th wettest for Charleston, WV.
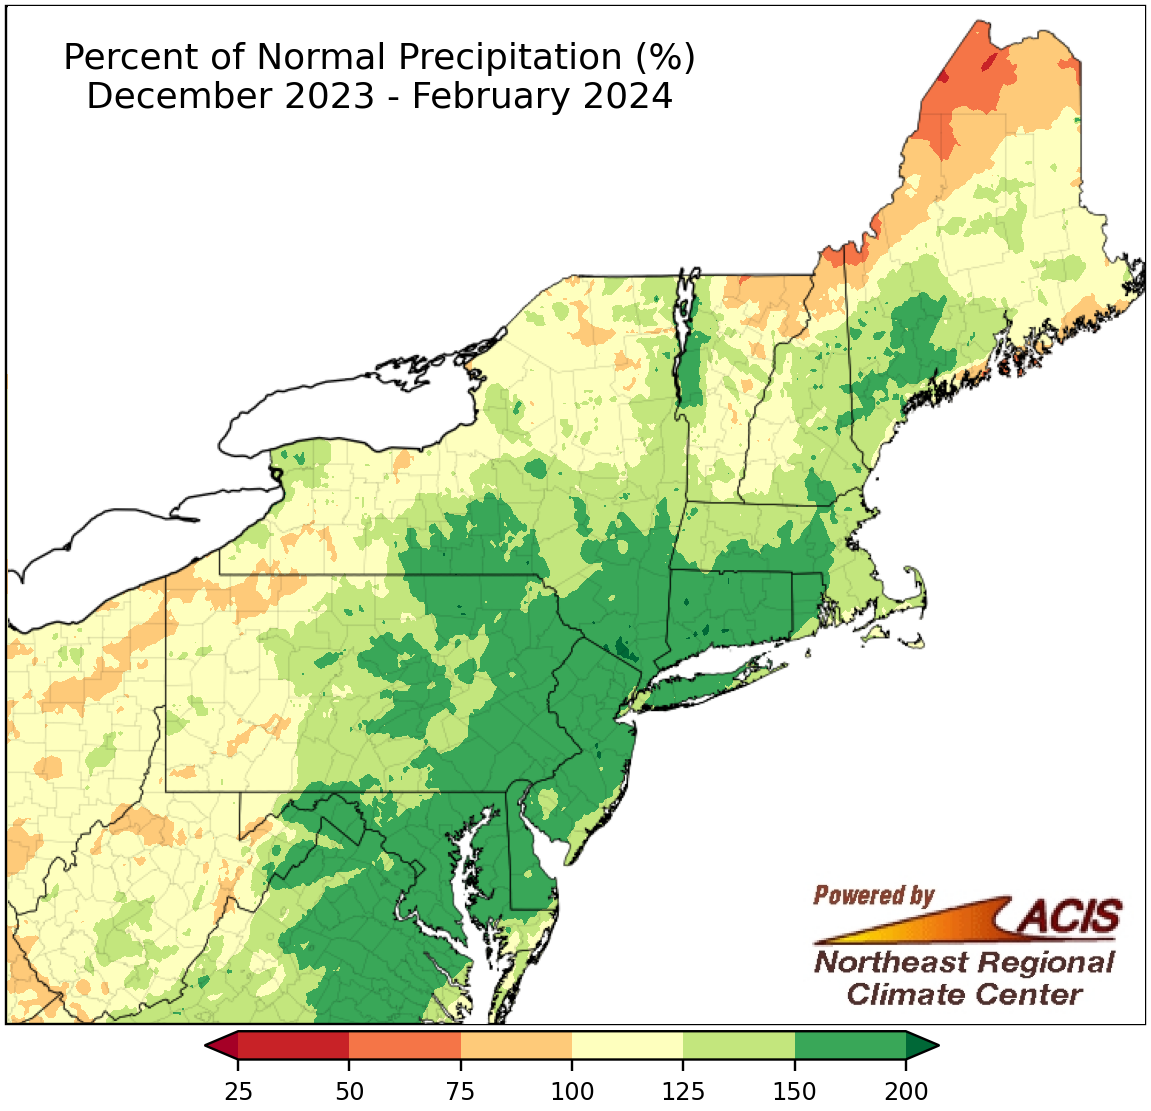
Winter precipitation ranged from 75% of normal to 200% of normal.
While February was a dry month, December and January were firmly on the wet side of normal for a large chunk of the Northeast. This wetness prevailed for the winter season, with precipitation ranging from near normal to 200% of normal for most areas. The exceptions were sprinkled throughout interior and northern locations such as western Pennsylvania and northern Maine, with these areas generally seeing 75% to 100% of normal precipitation. Winter 2023-24 was record wet for four major climate sites and among the 15 wettest for another 23 of the region’s 35 major climate sites. Overall, winter precipitation ranged from 78% of normal in Caribou, ME, to 174% of normal in Hartford, CT, and Scranton and Allentown, PA, with only two major climate sites being drier than normal.
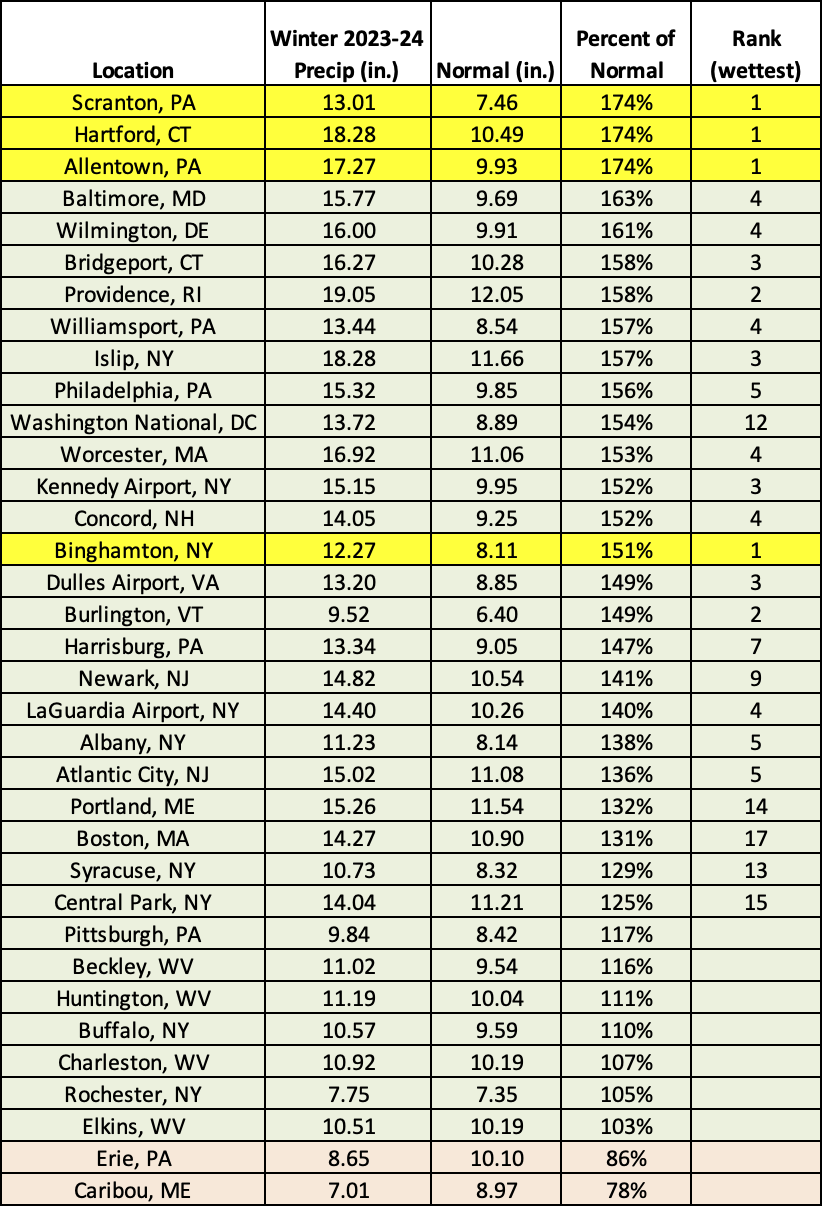
This winter was record wet for four major climate sites and among the 15 wettest for another 23 of the sites.
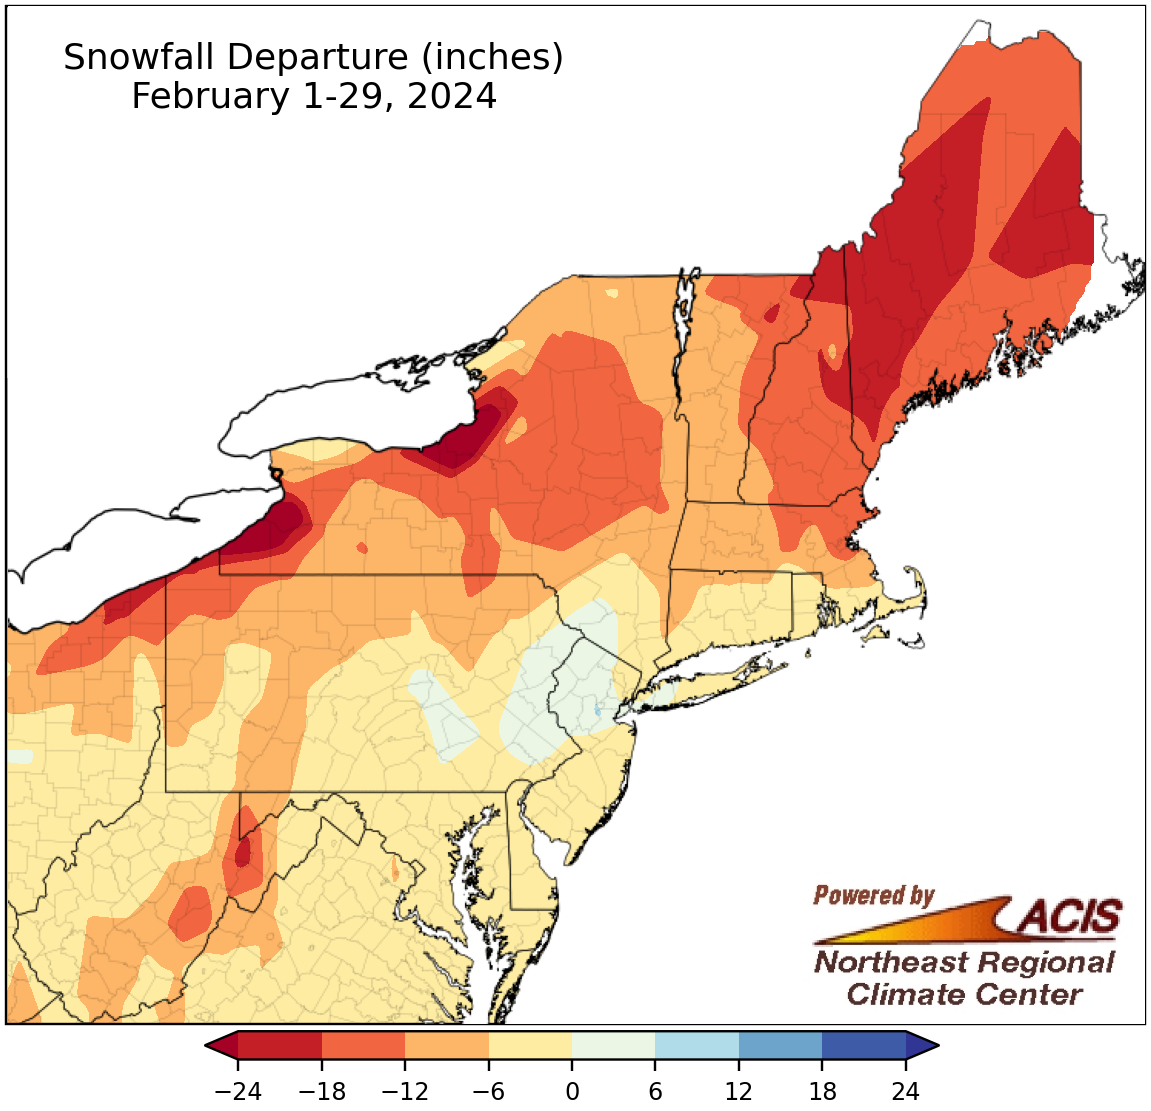
February snowfall ranged from more than 24 inches below normal to 6 inches above normal.
With warm temperatures and reduced precipitation, February snowfall for much of the Northeast was also in the red (and orange and yellow on the map). The largest deficits of over 24 inches were in lake-effect areas of New York. Interestingly, record-low ice cover on the Great Lakes and a brief cold spell allowed sites like Syracuse, NY, to tack on a few additional inches to their snowfall tally on the last day of the month. Binghamton and Albany, NY, had their least snowy February on record, while another nine of the region’s 35 major climate sites had one of their 20 least snowy Februarys. However, a small area from eastern Pennsylvania into northern New Jersey and southeastern New York managed to see a small snowfall surplus of up to 6 inches. This included Kennedy Airport, NY, which recorded its 19th snowiest February. Overall, February snowfall for all the sites ranged from 18.6 inches below normal in Erie, PA, to 4.0 inches above normal in Allentown, PA, with 33 of the sites having snowfall decifits.
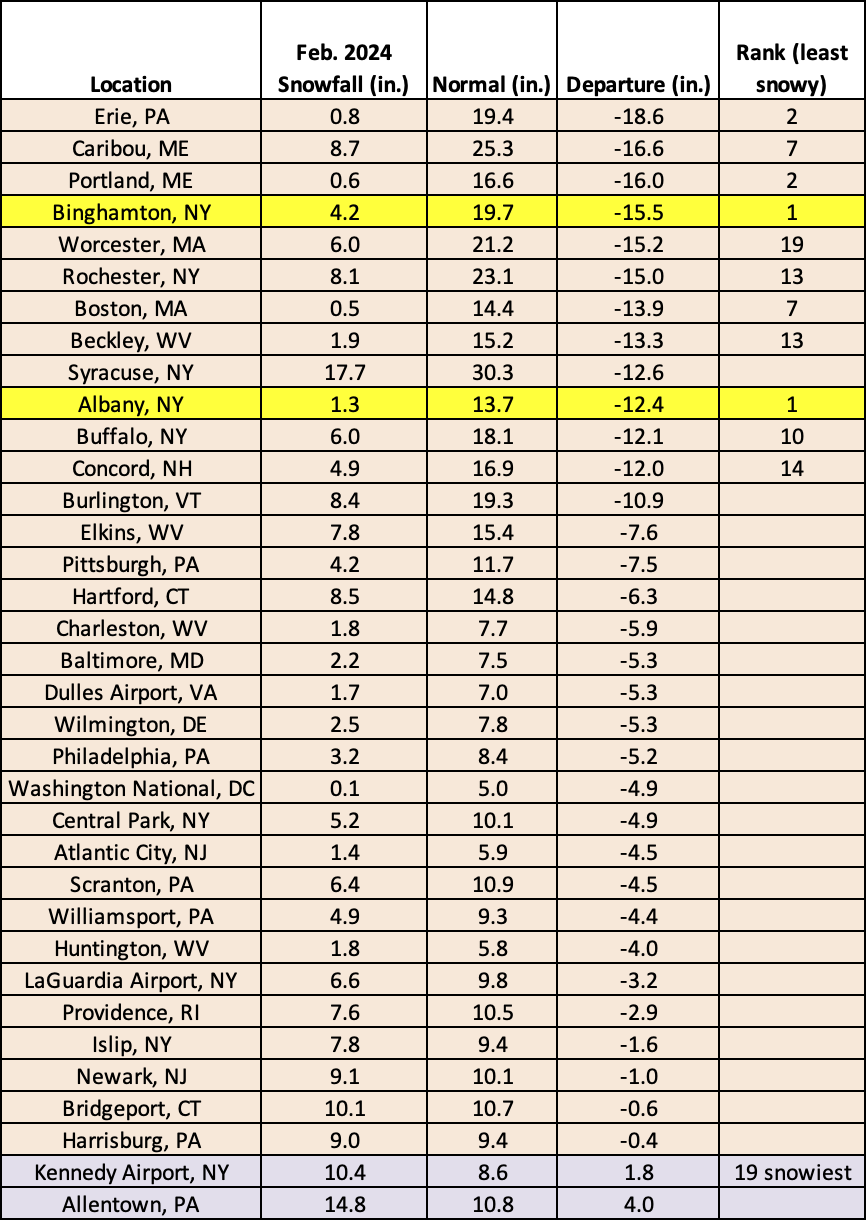
This February featured record low snowfall for two major climate sites and ranked among the 20 least snowy for another nine of the sites. Meanwhile, Kennedy Airport, NY, had its 19th snowiest February.
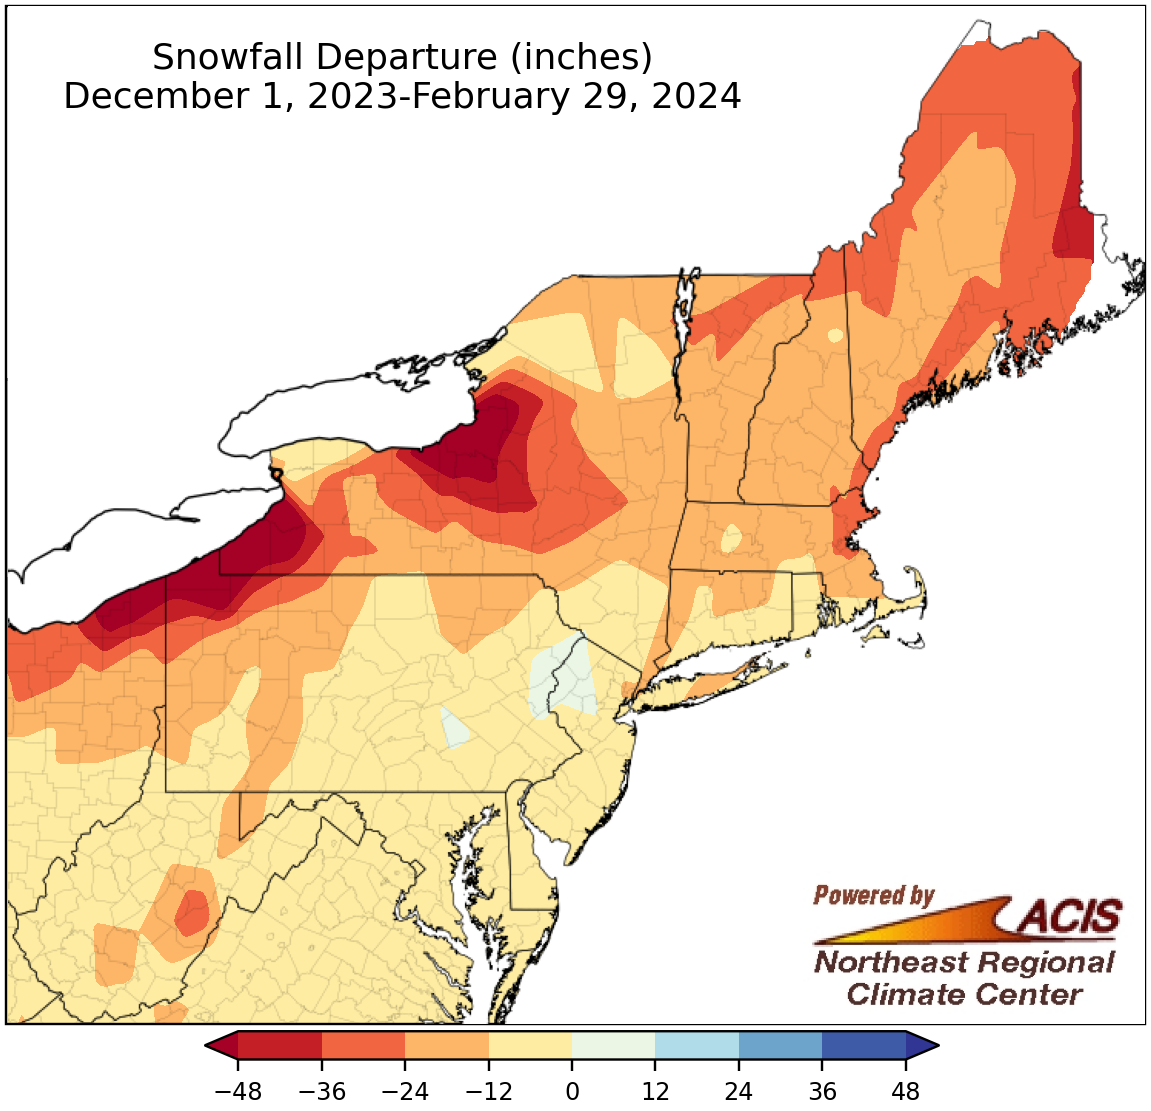
Winter snowfall ranged from more than 48inches below normal to 12 inches above normal.
December and February featured below-normal snowfall for most areas, while January snowfall was variable. As such, winter season snowfall was also below normal for almost the entire Northeast, with the largest deficits of over 48 inches in lake-effect areas of New York and northwestern Pennsylvania. Only a few locations in eastern Pennsylvania and northwestern New Jersey saw a snowfall surplus of up to 12 inches. At the 35 major climate sites, winter snowfall ranged from 60.6 inches below normal in Erie, PA, to exactly normal in Allentown, PA. This winter ranked among the 20 least snowy on record for 10 major climate sites.
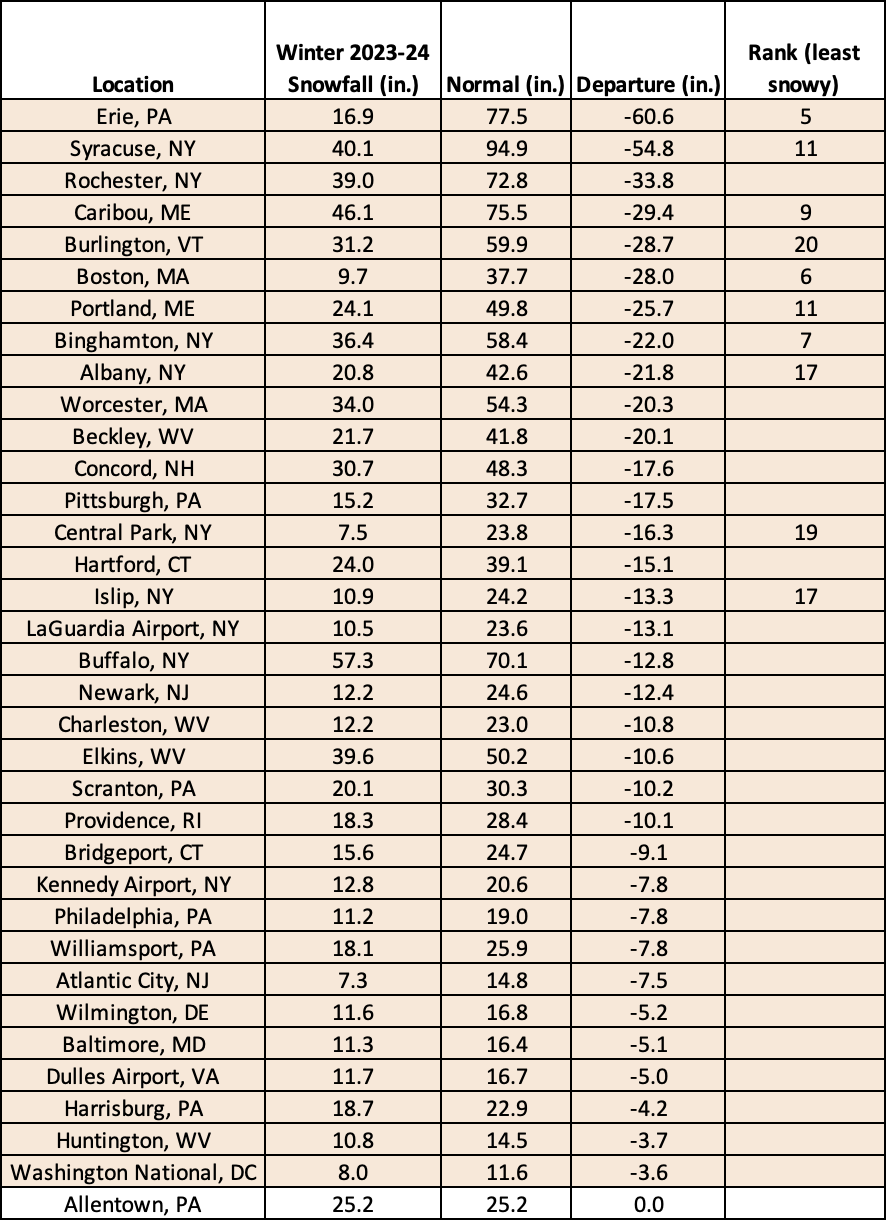
This winter was among the 20 least snowy for 10 major climate sites.
The first month of meteorological spring could bring a return of wetter weather to portions of the Mid-Atlantic, southeastern New York, and southern New England, according to NOAA’s Climate Prediction Center. March could bring more of the same warmth we’ve experienced this winter as the entire Northeast is favored to see above-normal temperatures. The first signs of spring are already moving up the East Coast, which is earlier than usual. This unusual warmth brings the concern of a damaging late spring freeze, with just that happening in May 2023 after the warm winter of 2022-23.
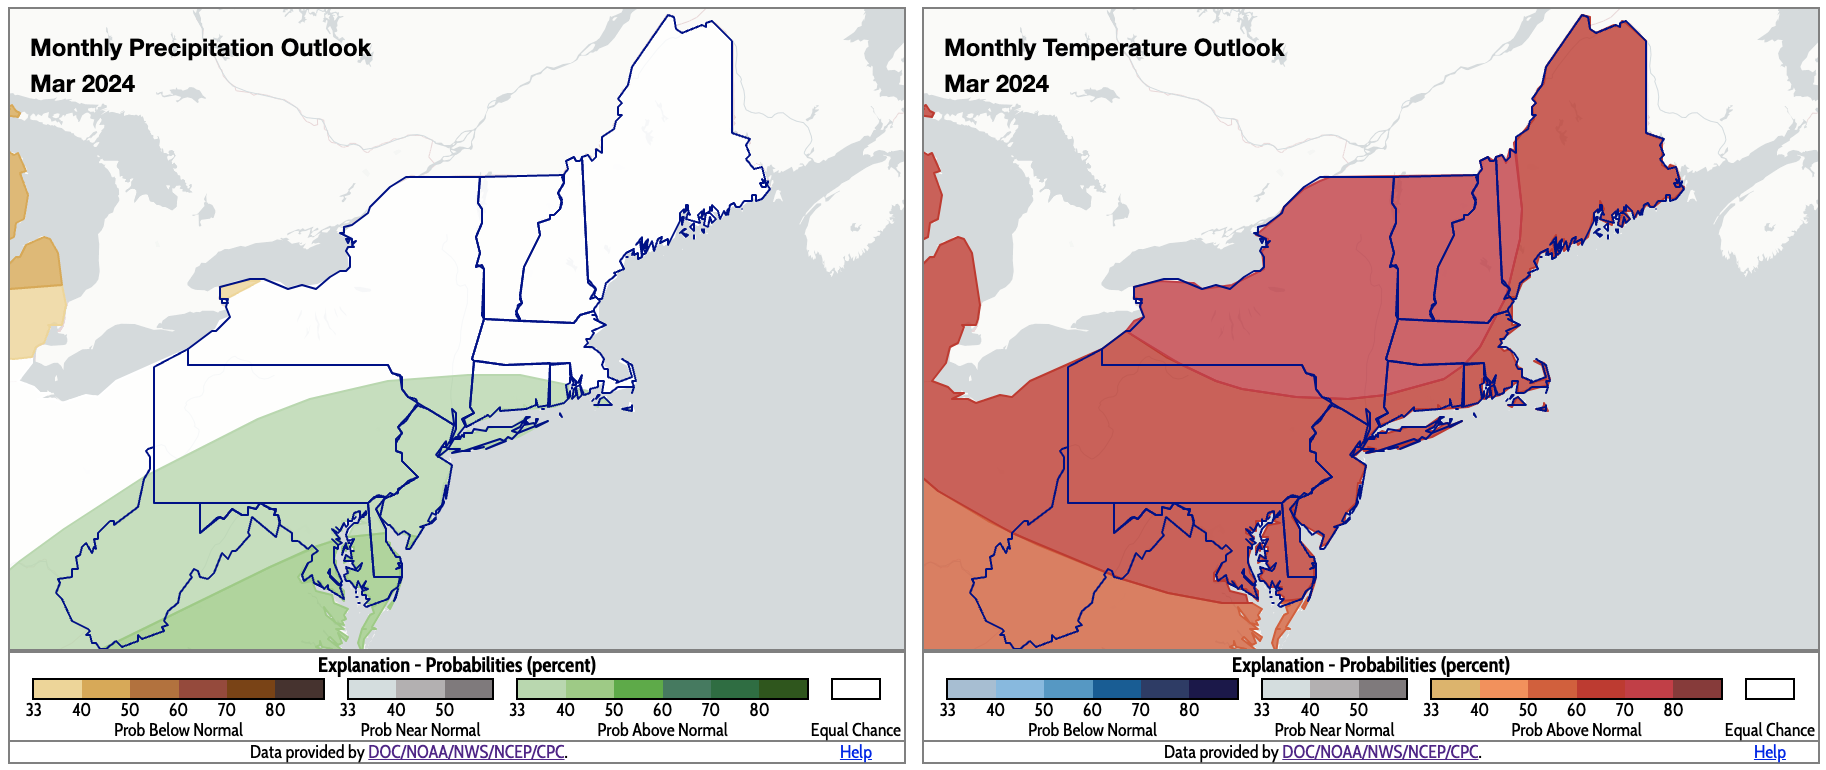
For March, there’s an increased likelihood of above-normal precipitation for some southern and coastal areas. The outlook favors above-normal temperatures for the entire Northeast. Click to enlarge.