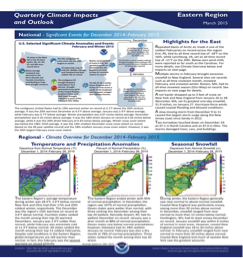
Abundant April Showers For Some
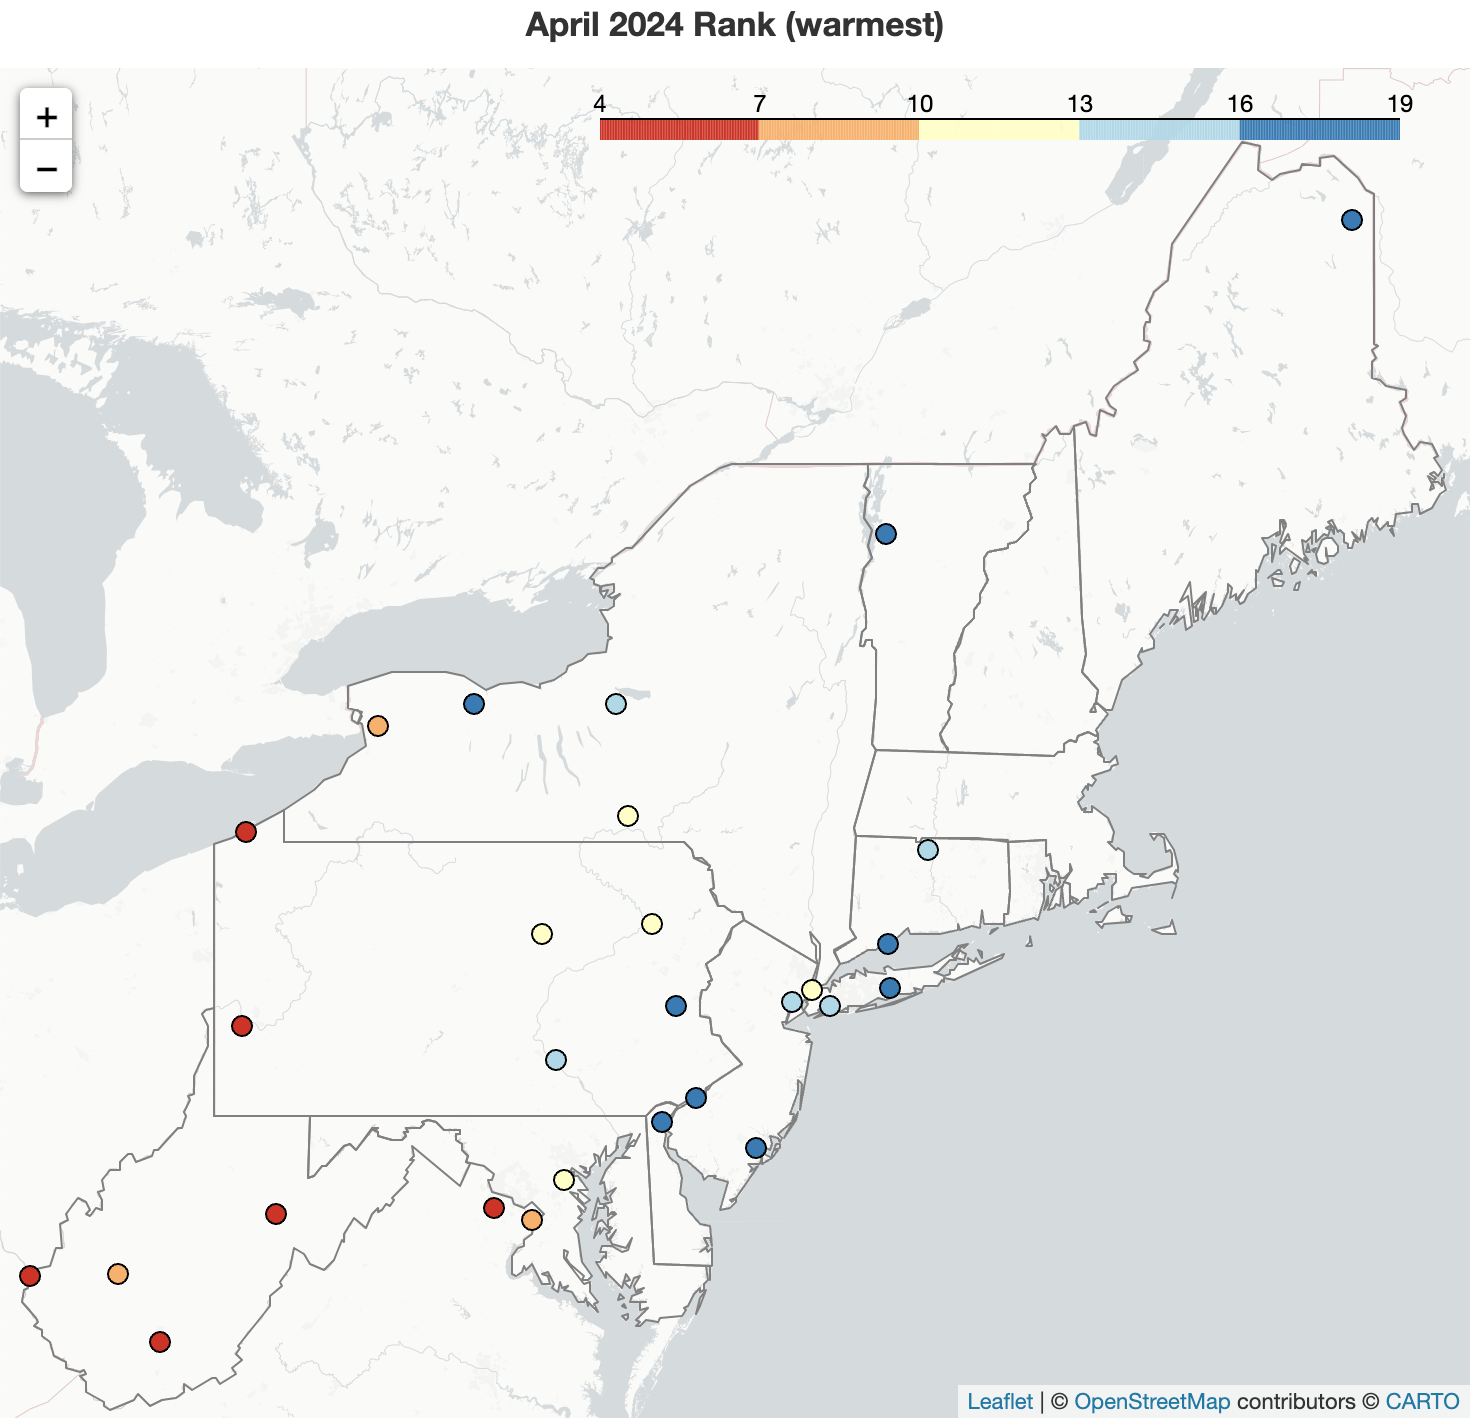
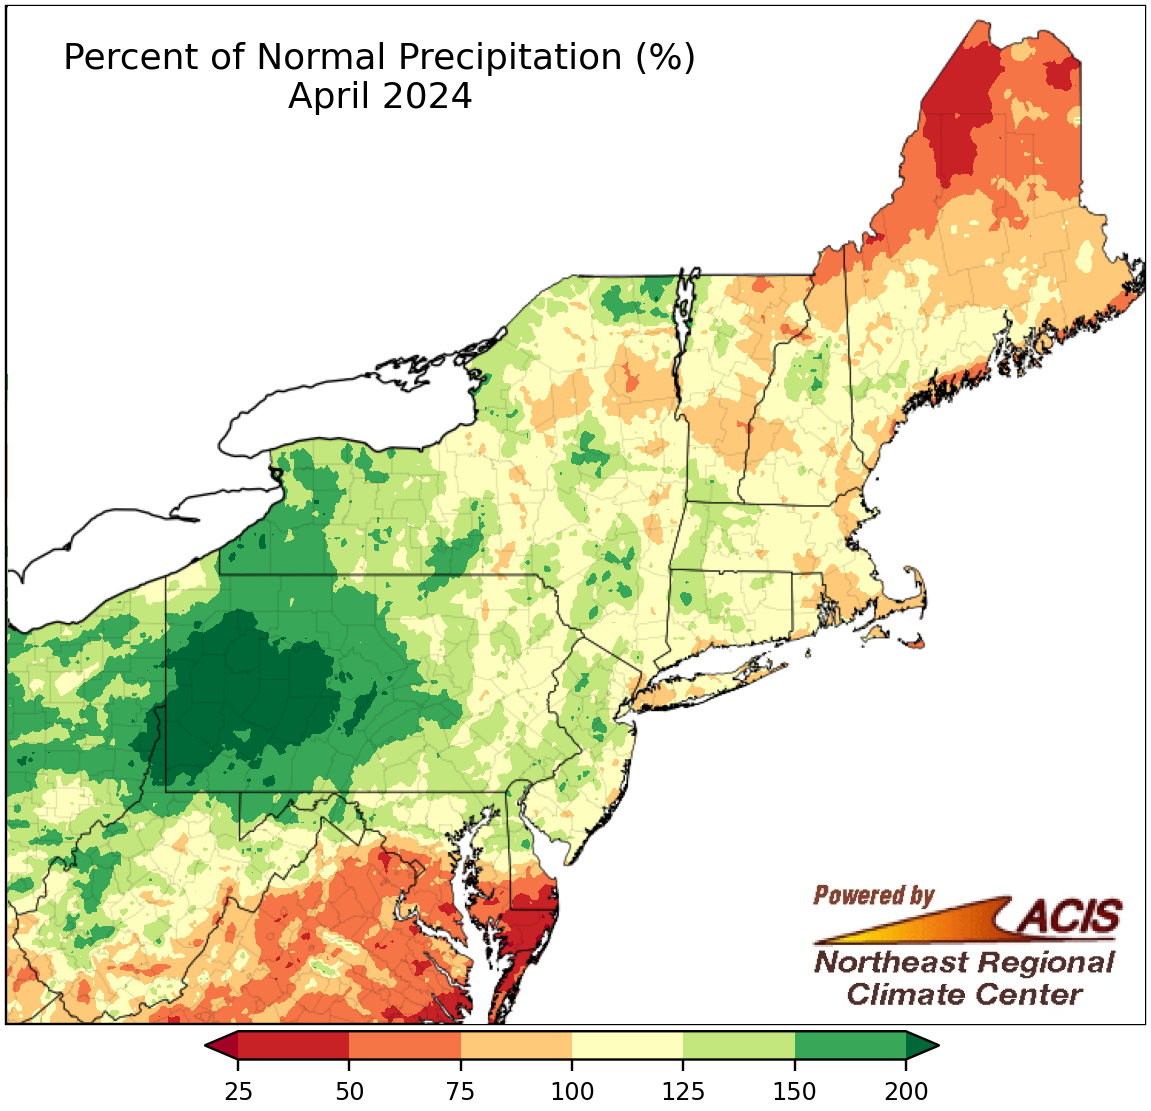
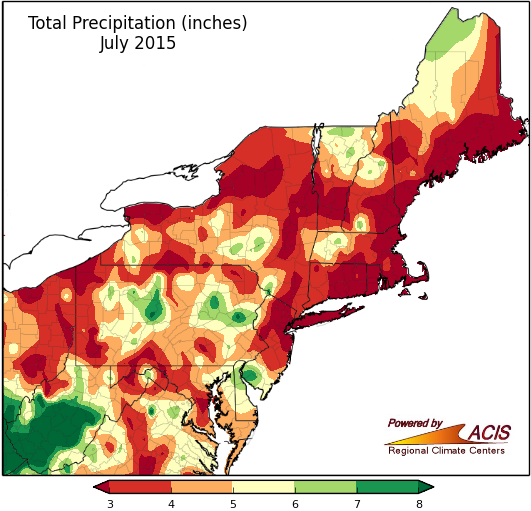
April was yet another warmer-than-normal month for much of the Northeast, ranking among the 20 warmest Aprils on record for 28 of 35 major climate sites. While some interior parts of the Northeast were saturated, the extreme ends of the region were much drier. An early month storm gave some northern locations a snowfall surplus; however, much of the region saw below- or near-normal monthly snowfall.
Read more in the NRCC BlogClimate News
Average Date of Last Frost
The average date of the last spring frost (32°F) varies widely across the Northeast, generally ranging from late March in some southern and coastal locations to late May in some northern and higher-elevation locations. At the region’s 35 major climate sites, the average date of the last spring frost, based on data from 1991-2020, ranges from March 24 in Washington, D.C., to May 14 in Caribou, ME, with the date falling sometime in April for a majority of the sites. When compared to data from 1981-2010, these dates have shifted earlier for 21 of the 35 sites. For instance, Philadelphia, PA’s average date of last spring frost was April 2 based on 1981-2010 but is now March 30 based on 1991-2020. Looking at all years of data for each of the major climate sites, the earliest last spring frost occurred in late February in Washington, D.C., and Central Park, NY, while the latest date was in early July in Elkins, WV. Maps of the average date of last spring frost (32°F) and last spring freeze (28°) for different normals periods can be found on our website on the Climate Normals Maps page.
Website Highlights
Weather Station Data
Weather Station Data includes location-specific information, such as wind data, evapotranspiration, and daily almanacs.
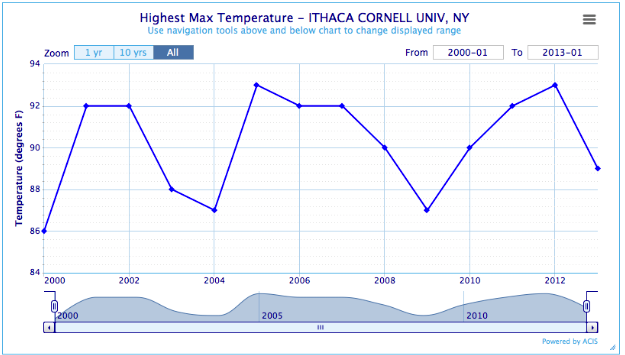
CLIMOD 2 is a user-friendly website to find single-station and multi-station climate products for locations accross the country. For example, the Seasonal Ranking report produces a graph and table of extremes or other summaries for a specified period for each year.
Go to CLIMOD 2State & Regional Analyses
These provide several map types, regional climate summaries, snow survey data, and drought information.
The Monthly Maps offer a variety of monthly precipitation and temperature departure maps for any given month for the Northeast region or a selected state.
Go to Monthly Map pageAnalyses for Industry
Analyses for Industry shows products the NRCC has created through partnerships with various industries.
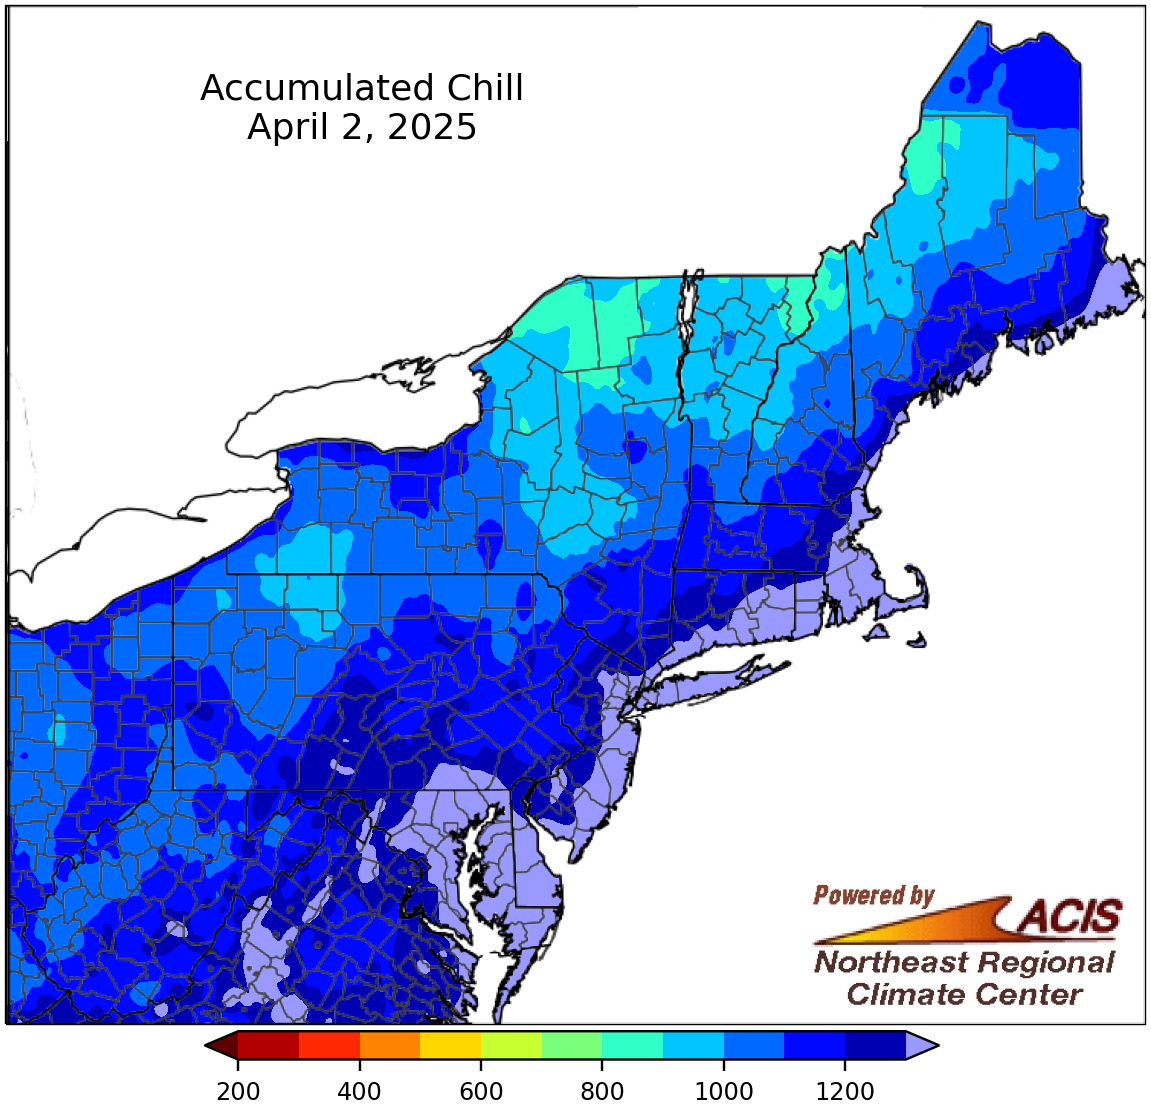
The Apple Frost Risk page has maps and animations for Red Delicious, Empire, and McIntosh apples. The maps show accumulated chill, growing degree days, phenological stages, and kill probability.
Go to Apple Frost RiskClimate Change Resources
Climate Change Resources includes normal difference maps as well as climate links.
Climate Links offer an abundance of resources for the Northeast across multiple sectors …
Go to Climate Change Resources pageWebinars & Workshops
Webinars & Workshops provides recordings and presentations from the monthly webinar series, as well as information on past and upcoming workshops.
The Northeast Regional Climate Center hosts a monthly webinar series with NOAA affiliates to address timely weather and climate concerns.
Go to Monthly WebinarsPublications & Services
Publications & Services includes the NRCC blog, quarterly outlooks, as well as other reports and publications.
The Quarterly Outlooks are seasonal climate highlights and outlook for the upcoming season for the Eastern, Region, Great Lakes, and Gulf of Maine. Published in March, June, September and December.
Go to Quarterly Reports