Extreme Heat and Severe Storms Usher in July
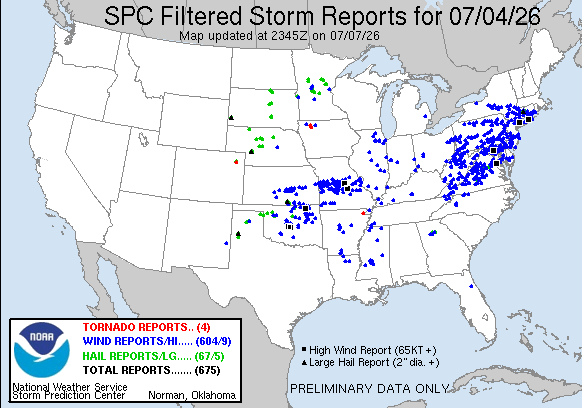
A prolonged heat wave kicked off July, setting records such as all-time hottest temperature, longest streak of days with a high of at least 100°F, and all-time hottest low temperature. Daily severe thunderstorms produced significant wind damage, particularly on July 4 in the Mid-Atlantic.
Read more in the NRCC BlogNortheast News
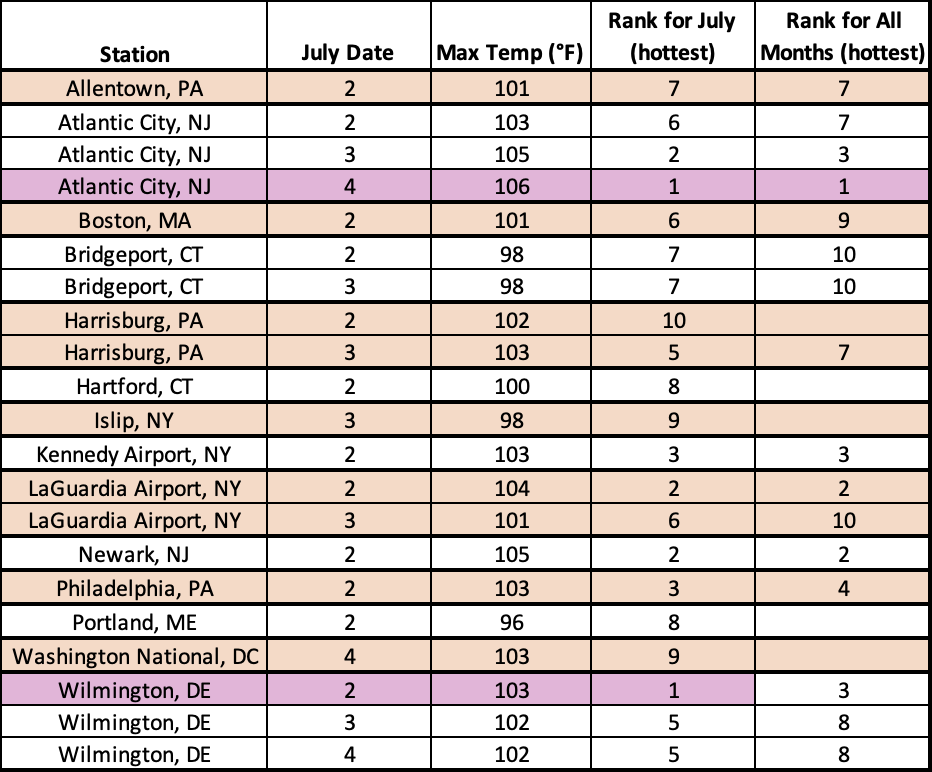
Early July Hazardous Heat Wave
On June 30, a significant heat event kicked off in the Northeast and was expected to last through July 5 in some locations. The highest temperatures were forecast to be in the 90s and 100s, challenging monthly high temperature records. For instance, Philadelphia, PA, was expected to reach 105°F, which (if it were to occur) would be its hottest July temperature on record. The persistent heat was also expected to challenge records. Forecasts showed Philadelphia reaching 100°F or higher on three consecutive days, which (if it were to occur) would tie as its longest such streak. Unusually high humidity (potentially reaching near-record to record levels) was expected to push the heat index well over 100°F in many locations. Overnight lows were predicted to remain in the 70s and 80s, limiting relief from the heat and also challenging records. A blog to recap this event is planned for the week of July 6-10.
Website Highlights
Weather Station Data
Weather Station Data includes location-specific information, such as wind data, evapotranspiration, and daily almanacs.
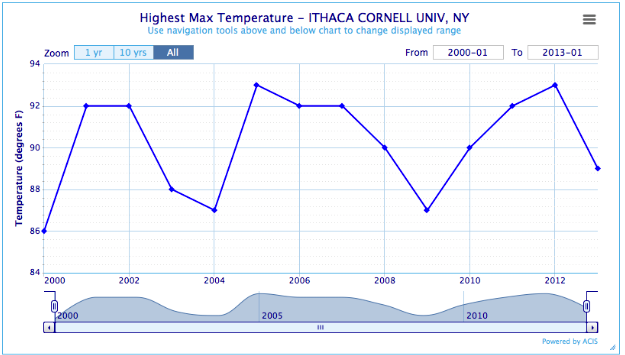
CLIMOD 2 is a user-friendly website to find single-station and multi-station climate products for locations accross the country. For example, the Seasonal Ranking report produces a graph and table of extremes or other summaries for a specified period for each year.
Go to CLIMOD 2State & Regional Analyses
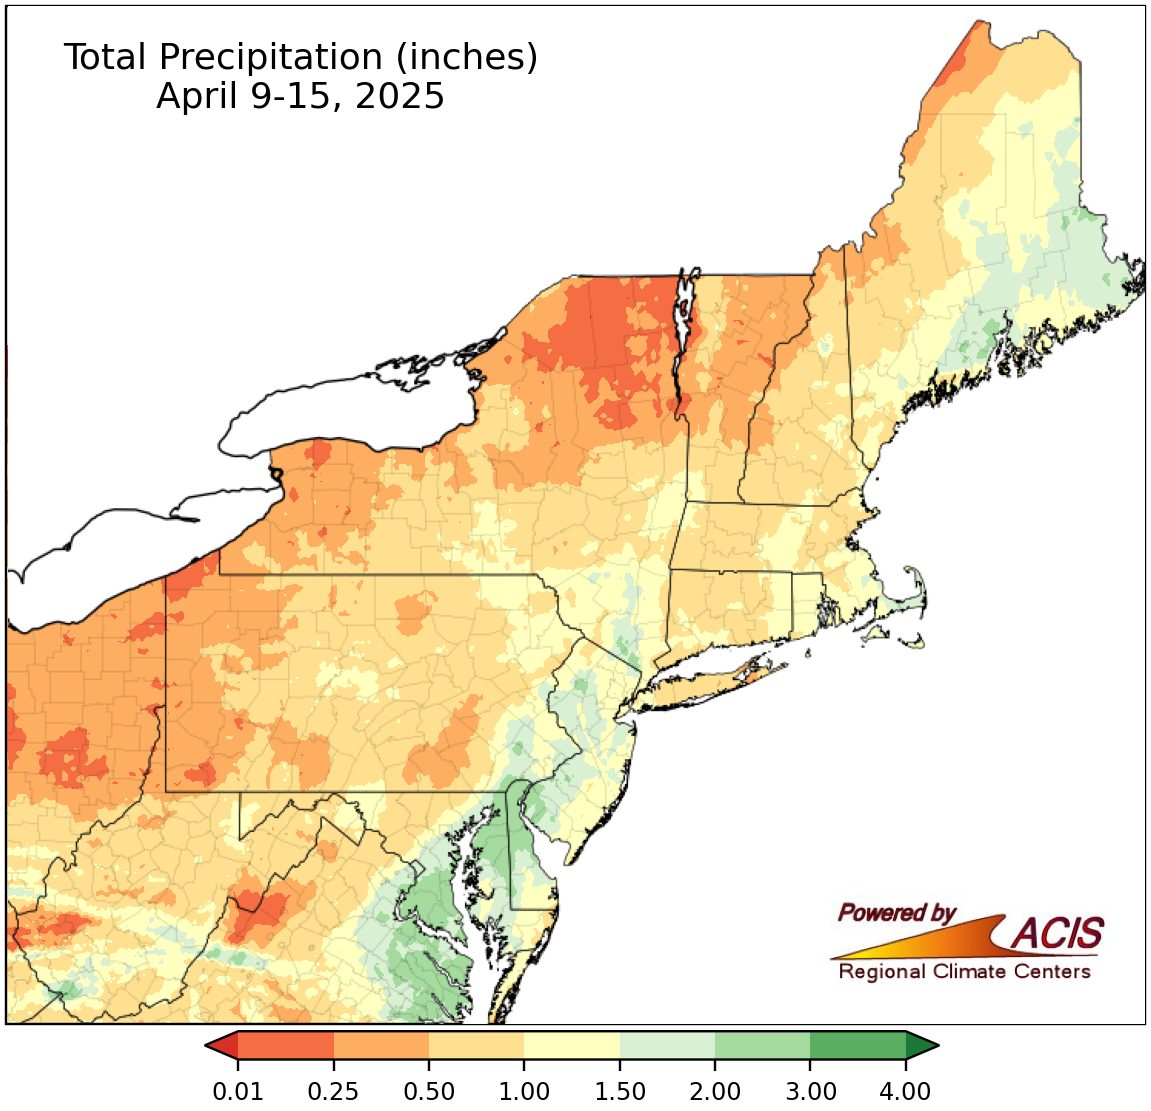
These provide several map types, regional climate summaries, snow survey data, and drought information.
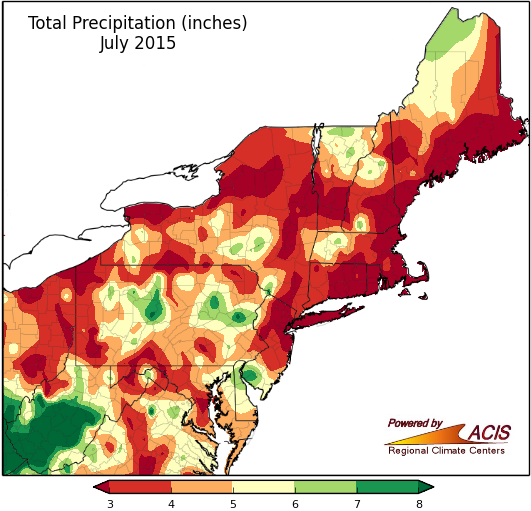
The Monthly Maps offer a variety of monthly precipitation and temperature departure maps for any given month for the Northeast region or a selected state.
Go to Monthly Map pageAnalyses for Industry
Analyses for Industry shows products the NRCC has created through partnerships with various industries.
The Turf Grass page offers weather for the turfgrass industry, including disease risk, turf and weed development, irrigation information, and heat stress.
Go to Turfgrass pageWebinars & Workshops
Webinars & Workshops provides recordings and presentations from the monthly webinar series, as well as information on past and upcoming workshops.
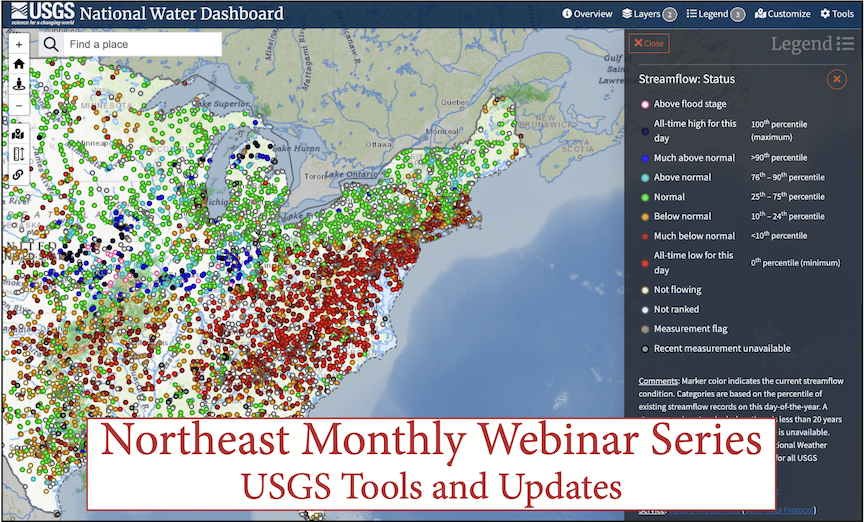
The Northeast Regional Climate Center hosts a monthly webinar series with NOAA affiliates to address timely weather topics.
Go to Monthly WebinarsPublications & Services
Publications & Services includes the NRCC blog, quarterly outlooks, as well as other reports and publications.
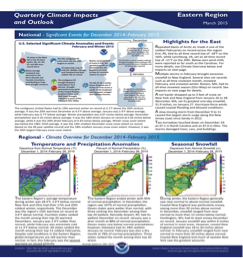
The Quarterly Outlooks are seasonal climate highlights and outlook for the upcoming season for the Eastern, Region, Great Lakes, and Gulf of Maine. Published in March, June, September and December.
Go to Quarterly Reports